
Reports and Analytics
Monitor user performance, analyze results, and get valuable insights to improve your quizzes and interactions.

Global Reports
Get a full overview of all your quizzes in one place, allowing you to easily track overall performance and spot general trends across your content.
Detailed Attempt Insights
Explore each quiz attempt in detail, including user answers, scores, and behavior, so you can better understand how users interact with your quizzes.
Visual Statistics
Make sense of your data with clear and engaging charts and graphs that help you quickly identify patterns and key performance metrics.
Exportable Reports
Download your reports in convenient formats that allow you to easily share your results with other people the information for further analysis.
Advanced Quiz Reports & Performance Insights
- Global Quiz Reports Overview
- Average Score Tracking
- Passed Users Count
- Unfinished Results
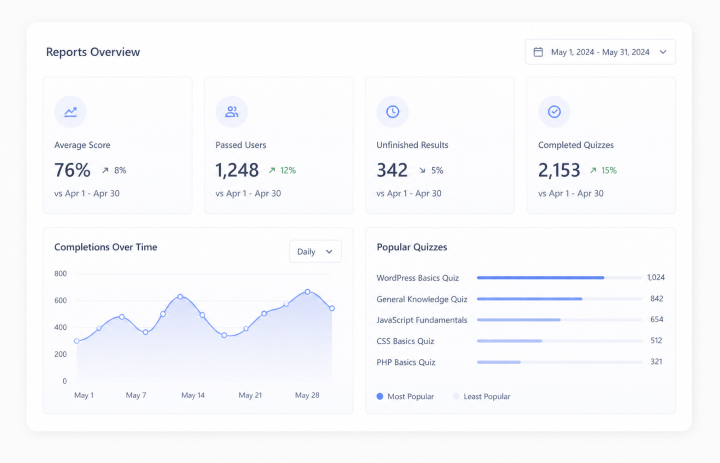
Get a complete overview of your quiz performance with global reports that bring all your data into one place. Track average scores to measure overall difficulty and user success, monitor how many users pass your quizzes, and identify unfinished attempts to spot drop-off points. Analyze completions over time to understand engagement trends, and quickly discover your most popular and least popular quizzes to optimize your content strategy and improve results.

Single Quiz Statistics
Analyze each of the quizzes on its own with detailed statistics that provide you with more information about the behavior of users. Analyze quiz performances based on their scores, track keywords to know about patterns of answers, analyze points and percentages to determine their correctness. Also, observe completion trends to see when and how users complete your quizzes.
Question Performance Analytics
Understand how each question performs with detailed analytics that show how many users answered correctly. Easily identify difficult questions based on low success rates and detect which ones may need improvement. Analyze correctness by category to see which topics your audience understands best and where they struggle, helping you optimize your quiz content more effectively.

Attempt progress tracking
Track user progress throughout each quiz attempt and see how far they get before leaving. Easily identify unfinished quizzes and understand where users drop off. Monitor saved and resumed attempts, including paused sessions, answered and unanswered questions, and the time spent before exit, helping you improve user experience and completion rates.
Advanced Report Export
Export your quiz results easily into a variety of file formats such as CSV, XLSX, and JSON for further use or distribution. Utilize powerful filtering options to export only the data that is relevant to you, whether by date range, user, individual quiz, or guest users.
Leaderboards, Ratings & User Feedback Insights
Showcase top performers with global quiz leaderboards, track rankings for each individual quiz, and compare results across different categories. Collect and display user ratings along with detailed reviews to better understand feedback, build credibility, and improve your quizzes based on real user opinions.


Detailed User Behavior Reports
Access detailed reports that show how users behave during quiz attempts. Track tab switching activity, see how much time users spend outside the quiz tab, and monitor their overall behavior throughout the attempt. All this data is available in your reports, helping you better understand user focus and improve quiz reliability.
Traffic Source Reports & Campaign Tracking
Get access to reports that can help you know the sources of traffic for your quiz by using URL parameter tracking. Get an idea of how each participant reached your quizzes through either campaigns, advertisements, or any other links. This information is included in your reports.
Automated Email Reports & Insights
Receive summary reports directly to your email and stay updated without logging in. Get hourly, daily, weekly, or monthly reports for a single quiz or all your quizzes, so you can easily monitor performance, track results, and stay on top of your data anytime.
Use Cases
See when you can use reports for quizzes.
E-Learning
Use reports and analytics to track learner progress, identify knowledge gaps, and improve overall learning outcomes.
Online Exams
Monitoring performance through the use of reports will help to determine the outcome and identify any weaknesses.
Lead Generation
Analyze user data and traffic sources to understand which quizzes bring the most leads.
Employee Training
Track employee performance through reports to measure training effectiveness and improve skill development.
Personality Quiz
Track the user results with the reports to get a better understanding of your main audience.

Show Frontend Statistics and Analytics with shortcodes
- User Progress
- User History Quiz
- User Best Score
- User Activity Per Day
- Quiz Activity Per Day
Frontend statistics and analytics shortcodes allow you to display key quiz insights directly on the frontend. You can show charts, tables, and personalized performance data such as user progress, quiz history, best scores, and daily activity-making analytics accessible not only to admins but also to users.
How It Works
Create Quiz
Create your quiz with different question types and logic to match your use case.
Collect Attempts
Gather real user responses as users take quiz across different devices and traffic sources.
Analyze Performance
Turn data into insights to understand user behavior, improve questions, and boost results.
Frequently Asked Questions
Can I track individual user progress in quizzes?
Yes, you can track each user's progress in detail across any quiz they take. This includes their selected answers, completion status, time spent on questions, and overall performance. It helps you understand not just final results, but the full journey of each user through the quiz.
What kind of analytics can I see on the frontend?
You can display a wide range of analytics directly on the frontend using shortcodes, including user progress, quiz history, best scores, and daily activity. These insights can be presented as charts or tables, making the data easy to understand for both admins and users without accessing the backend.
Can I see which questions users struggle with the most?
Yes, the system allows you to analyze question-level performance, so you can clearly see which questions have higher error rates or lower success rates. This helps you identify confusing or overly difficult questions and improve the overall quality and balance of your quizzes.
Is it possible to track quiz activity over time?
Absolutely. You can monitor quiz activity on a daily basis and track engagement trends over time. This includes how many users are taking quizzes each day, peak activity periods, and changes in participation rates, which helps you optimize timing and content strategy.
Can users see their own results and history?
Yes, if you enable frontend analytics shortcodes, users can access their own performance data. They can view past quiz attempts, check their scores, and track their progress over time, which creates a more engaging and personalized quiz experience.
What's the benefit of showing analytics on the frontend?
Displaying analytics on the frontend significantly increases user engagement because users receive instant feedback on their performance. It also adds transparency and interactivity to your quizzes, making them more than just assessments-they become part of a continuous learning or engagement experience.
Can I compare user performance across multiple quizzes?
Yes, you can analyze and compare results across different quizzes to get a broader understanding of user behavior and performance. This is especially useful if you run multiple quizzes for different topics, campaigns, or training purposes, as it helps you see overall patterns and effectiveness.
Need More Details?
Explore the Quiz Maker documentation for detailed options, settings, and best practices.
