


A public opinion research project exploring attitudes about government.


A public opinion research project exploring attitudes about government.
Americans believe increased security measures implemented by federal, state, and local governments since 9/11 have come with benefits and costs for both security, freedom, and privacy.

I am going to read you several statements. For each statement, please tell me if you agree or disagree with that particular statement:

Find full results here.
With the 10th anniversary of the Sept. 11 terrorist attacks approaching, 55 percent of Americans say “we have given up too much freedom and privacy in the name of security” since the attacks, according to a new national Reason-Rupe Public Opinion Survey of 1,200 adults.
Nearly, 79 percent of Americans feel we have less privacy now than we did before 9/11 and 62 percent say we have less personal freedom today. However, 81 percent have faith that the security measures implemented since the attacks make us safer overall.
Only 15 percent of the public is “very confident” that the Department of Homeland Security, created following 9/11, will prevent another terrorist attack on U.S. soil. Another 40 percent are somewhat confident and 21 percent are slightly confident that the agency will prevent an attack.
When it comes to airport security, 49 percent of Americans believe the Transportation Security Administration (TSA) would catch a terrorist trying to board a plane at a U.S. airport, while 44 percent say the TSA would not. Confidence in the TSA is notably high among Democrats, who, by a margin of 54 percent to 38 percent, believe the TSA would capture a terrorist trying to get on a plane. Conversely, by 51 percent to 45 percent, Republicans do not think TSA screeners would spot a terrorist.
Over 41 percent of the public supports replacing TSA screeners with airport security screeners from private companies who would work under government oversight, but 47 percent of those polled oppose such a change. Here again, Democratic support for the TSA is noteworthy. Fifty-nine percent of Democrats oppose a return to private security screeners, with only 30 percent in favor. In contrast, 55 percent of Republicans support privatizing airport security screeners and 35 percent oppose doing so.
As the wars in Afghanistan and Iraq continue, just 19 percent of Americans believe leaving U.S. troops in Afghanistan until at least 2014 will make us safer, while 65 percent think it will make no difference in our safety and 12 percent contend it will make us less safe.
In evaluating the war in Iraq, 62 percent of Americans say the war has not been worth it for the United States.
And a nearly identical number of Americans, 61 percent, say the United States uses its military force in too many foreign conflicts. Twenty-five percent say the US military is used in the “right amount” of foreign conflicts and 9 percent say the military is not used enough.
Full Poll Online
The complete Reason-Rupe survey is online here (pdf).
This Reason-Rupe poll, conducted August 9-18, 2011, surveyed a random, national sample of 1,200 adults by telephone (790 on landlines, 410 on cell phones). The results have a margin of error of plus or minus 3 percentage points. The poll was conducted for Reason Foundation by NSON Opinion Strategy.
This is part of a series of Reason-Rupe public opinion surveys dedicated to exploring what Americans really think about government and major issues. This Reason Foundation project is made possible thanks to the generous support of the Arthur N. Rupe Foundation.
The latest Reason-Rupe survey results reveal diverse attitudes toward Social Security and Medicare and towards the potential for reform.
Overwhelmingly, Americans view Social Security and Medicare as “contributive” programs, meaning that they believe that all Americans who contributed should be rewarded by receiving their benefits.


This conceptualization of entitlements as “contributive” rather than “redistributive” was explored and discussed in a previous post. Our findings reveal that a majority of Americans are open to entitlement reform as long as they are guaranteed to receive the money they have already contributed into the two programs.


This also helps potentially explain why 67 percent of Americans oppose raising the retirement age. If a majority of Americans view these programs as contributive and essentially a contract with the government, it explains why they would not want the government to change the terms of the contract for when they start getting their money back.

When asked what the Social Security retirement age should be, results ranged from 65 to 75, with a median of 65.

Nevertheless, Americans favor allowing individuals to opt out of the programs if they choose.


In part, this result is likely driven by the 60 percent of individuals who believe that they are primarily responsible for saving enough money to meet basic expenses in retirement. However, only 43 percent believe they are personally responsible for saving enough money to purchase health insurance in retirement.


Most Americans are also not convinced that they will receive back the money they have already contributed to the Social Security system. Retirees, however, are more confident that they will continue to receive expected benefits, in contrast to those who have not yet retired.
Expectations for Social Security Benefits

According to a recent Reason-Rupe poll, a majority of Americans favor reforming Social Security (61 percent) and Medicare (59 percent) if they are guaranteed to get back what they originally contributed into the system. This reveals important information about how the public conceptualizes entitlements in general and what policymakers must consider in order to reform the system. Moreover, a majority of people would also favor allowing workers to opt out of Social Security (54 percent) and Medicare (56 percent).
These results conflict significantly with the findings of other polls. The following will explain why.
Media poll after poll after poll, as well as left-leaning polls and right-leaning polls, have clearly demonstrated that the public does not want to cut spending for two of the largest federal programs: Social Security and Medicare. The media and political class have understandably come to theconclusion that, “It has become a maxim of U.S. politics that Americans approve of cutting spending in concept but disapprove of cutting specific programs.” The Associated Press explains its AP-GfK poll results by arguing that “most Americans say they don't believe Medicare has to be cut to balance the federal budget, and ditto for Social Security." If one were to digest all of the commentary and polling data, one would likely conclude that not cutting Social Security or Medicare is one of the few things that most Americans agree on.
Moreover, as Fox Business Channel host John Stossel pointed out recently on his show, even among Tea Party supporters, 62 percent believe entitlements are worth the costs, compared to 33 percent of those who said entitlements are not worth it. This suggests hypocrisy among the movement that is most vocal about reducing the size of government.
Recent results from the Reason-Rupe poll dig deeper into American attitudes to reveal why these aforementioned survey questions do not get at how Americans actually conceptualize these programs. In fact, our results show that a majority of Americans are open to entitlement reform.
We started by asking the standard questions asked in the aforementioned polls:
“Would you be willing to have your current or future Social Security benefits reduced as part of a plan to balance the federal budget or ensure the Social Security program remains in place for future retirees?”
Not surprisingly, a similar proportion (57 percent) oppose.
“Would you be willing to have your current or future Medicare benefits reduced as part of a plan to balance the federal budget or ensure Medicare remains in place for future retirees?"
Again, not surprisingly, a similar proportion (51 percent) oppose.
However, we next asked if respondents would favor reductions in their Social Security and Medicare benefits if they were still guaranteed to receive at least the amount of money that they have contributed into the system. (Please review Methodology Detail below)
Interestingly our results flipped, with 61 percent and 59 percent, respectively, agreeing.
Would you be willing to have your current or future Social Security benefits reduced as part of a plan to balance the federal budget or ensure the Social Security program remains in place for future retirees?/or if you were still guaranteed to receive at least the amount of money that you have contributed into the system?
Would you be willing to have your current or future Medicare benefits reduced as part of a plan to balance the federal budget or ensure Medicare remains in place for future retirees?/ or if you were still guaranteed to receive at least the amount of money that you have contributed into the system?
Entitlements have two components. The first is a “savings account” component such that individuals contribute money to Social Security and Medicare from their paychecks. Second, entitlements include a redistributive element whereby money from those with higher lifetime earnings is redistributed to those with lower lifetime earnings. These two components muddled together might help explain why both Republicans and Democrats generally favor these programs. According to Gallup data, support for the programs is virtually identical.

Source: Gallup
However, most poll questions that ask about reducing entitlement spending do not distinguish between these two components of the program. Moreover, it is not obvious that just because a person favors a Social Security savings account that they also favor having their income redistributed. The Reason-Rupe poll’s findings suggest that when these two components are disentangled, Americans care most about getting back the money they contributed to the system. They would even be willing to cut additional benefits they may have received, as long as they get what they earned and contributed. This shows that support for entitlement programs like Social Security and Medicare is largely driven by the “contributive” component rather than the redistributive component.
Understanding how the two separate components drive support for Social Security and Medicare makes it clear why Americans have appeared so intransigently averse to reform. It does not make sense to most people why government would need to cut Social Security and Medicare after they have already contributed so much of their own money towards the programs. If they had known that the government would renege on its contract, they could have simply put their money in a risk-free low-return savings account, where at least their principal would remain the same.
These findings also undermine the idea that limited government advocates who are adverse to cutting Social Security and Medicare spending are hypocrites. It is not necessarily the case that these individuals want to cut government spending for everyone but themselves; instead, they simply want to recoup the money that they have already contributed to the system. They just want their money back.
Find full results here.
Methodology Detail:
For Social Security
The survey first asked respondents: “Would you be willing to have your current or future Social Security benefits reduced as part of a plan to balance the federal budget or ensure the Social Security program remains in place for future retirees?”
| Yes | 37 |
| No | 57 |
| Don't Know | 6 |
| Total | 100 |
Then among those who answered “No” we asked: “Would you be more willing to accept reductions in your current or future Social Security benefits if you were still guaranteed to receive at least the amount of money that you have contributed into the system?”
| Yes | 43 |
| No | 53 |
| Don't Know | 4 |
| Total | 100 |
Then we combined those who answered, “Yes” to the first question and those who answered, “Yes” to the second question. This totals the percentage of Americans who would accept reductions in their Social Security benefits as part of a plan to balance the federal budget and/or if they were still guaranteed to receive at least the amount of money that they have already contributed into the system.
| Yes | 61 |
| No | 30 |
| Don't Know | 9 |
| Total | 100 |
For Medicare
The survey first asked respondents: “Would you be willing to have your current or future Medicare benefits reduced as part of a plan to balance the federal budget or ensure Medicare remains in place for future retirees?”
| Yes | 43 |
| No | 51 |
| Don't Know | 6 |
| Total | 100 |
Then among those who answered “No” we asked: “Would you be more willing to accept a reduction in your current or future Medicare benefits if you were still guaranteed to receive at least the amount you have contributed into the system?”
| Yes | 32 |
| No | 66 |
| Don't Know | 2 |
| Total | 100 |
Then we combined those who answered, “Yes” to the first question and those who answered, “Yes” to the second question. This totals the percentage of Americans who would accept reductions in their Medicare benefits as part of a plan to balance the federal budget and/or if they were still guaranteed to receive at least the amount of money that they have already contributed into the system.
| Yes | 59 |
| No | 33 |
| Don't Know | 8 |
| Total | 100 |
The results from the latest Reason-Rupe poll show ostensibly conflicting results about where Americans place the primary responsibility for retirement savings and for health insurance costs during retirement.
When the questions avoid the polarizing context of “entitlement reform” or the explicit mention of Social Security, a clear majority of Americans (60 percent) believe that they are primarily responsible for saving enough money to meet their own basic expenses in retirement. Roughly a third of Americans believe they should primarily expect help from the government to meet basic expenses in retirement.

When the question becomes who “should be primarily responsible for saving enough money to purchase health insurance in retirement,” just 43 percent of respondents believe they should be primarily responsible. Fifty percent believe they should primarily expect help from the government to acquire health insurance. This attitude may stem in part from the current regulatory framework, which makes it easier to obtain health insurance through employers. Thus it might not be clear to many Americans just how they would go about obtaining competitively-priced health insurance in the private market.

Despite these somewhat conflicting numbers, a substantial percentage of Americans do nonetheless believe they are primarily responsible for saving enough money to meet their own basic retirement expenses, including health insurance. This finding should prompt further discussion about reforming these massive programs, since nearly half—if not more than half—of Americans believe responsibility for retirement should lie with the individual.
Please find full results here.
As explored in our previous post, public sentiment has turned toward cutting government spending. Recent Reason-Rupe poll results help explain why Americans have focused their attention on spending cuts.
First, 69 percent of Americans anticipate their future taxes increasing, and 32 percent say they anticipate their taxes to “increase a lot” over the next five years. Twenty two percent expect their taxes to stay the same and only 6 percent expect their taxes to decrease.

Second, Americans do not expect future tax revenues to be used toward addressing the budget deficit and national debt as promised. Instead, 62 percent believe the government would use higher taxes to spend on new programs, compared to 27 percent who believe new taxes would be spent to reduce the deficit.

Third, most Americans believe that reducing spending will help the U.S. economy. Cutting government spending will undoubtedly help some and hurt some in the short run, but the question was asked about the net impact of reduced spending. Fifty seven percent of Americans believe it would mostly help, and 15 percent believe it would have no impact. Only 21 percent believe it would mostly harm the economy.

In summary, most Americans expect their taxes to go up, and then those increased taxes to be spent in ways other than addressing the budget deficit and national debt. Moreover, a majority of Americans believe that cutting spending will help the U.S. economy. Altogether, these help explain the focus on cutting government spending.
Please find full results here.
After billions in bailouts and stimulus spending, recent Reason-Rupe poll results reveal public sentiment has turned against government spending and shifted toward spending cuts. Although many Americans are not necessarily opposed to raising revenues (taxes) in some form or to raising taxes on the wealthy, the consensus wants Washington to focus on spending cuts, rather than on raising revenues.
Seventy seven percent of Americans believe the federal government should have a spending cap that prevents it from spending more than it takes in during a given year—62 percent believe this strongly. In addition, 69 percent favor a constitutional amendment requiring a balanced federal budget, with 50 percent strongly favoring such a reform.
Please tell me whether you agree or disagree with the following statement: "The federal government should have a spending cap that prevents it from spending more than it takes in during a given year."

Would you favor or oppose a constitutional amendment to require a balanced federal budget?

Respondents were asked about their preferred solution to reducing the $14.3 trillion national debt. At 57 percent, the most preferred solution was to focus on reducing spending, and possibly increasing some taxes. Only 23 percent wanted equal emphasis on both tax increases and spending cuts, while only 15 percent wanted to primarily rely on tax increases. Moreover, the plurality response at 37 percent was to decrease spending with no tax increases.
Overall, these results suggest that although the public is not necessarily averse to some revenue increases, the majority wants Washington to focus on reducing government spending.


Read full results here
The latest Reason-Rupe poll results reveal a potential opportunity for a third-party presidential candidate. Seventy two percent of Americans say they would or might consider voting for a third-party presidential candidate, while 48 percent of Americans say they would support a presidential candidate who was “conservative on economic issues and liberal on social issues.” Eighteen percent of Americans said they would strongly support such a candidate, and this is presuming the candidate ran under the banner of a third party. Finally, 37 percent of Americans said they would consider voting for a third-party Tea Party candidate if she or he entered the race against President Barack Obama and the Republican nominee in 2012. These are significant chunks of the population willing to consider and potentially vote for a non-conventional candidate.
Several factors are likely driving this support for non-conventional presidential candidates.
First, there is overwhelming evidence that the American electorate breaks down into more than just simple liberal or conservative blocs. ABC News analyst Matthew Dowd finds that 51 percent of Americans do not fit into conventional liberal or conservative buckets. Gallup finds that at least 44 percent of Americans do not fit this mold. The Reason-Rupe poll also finds that 44 percent do not fit this conventional division. These numbers suggest that traditional Democratic or Republican presidential candidates may not represent the political views of nearly half of all American voters.
Second, Dowd also explains how Obama’s low presidential approval ratings combined with the GOP presidential candidates’ inability to appeal to Independents may create a ripe environment for a third-party candidate to enter the race.
However, it is important to be clear that as a result of our electoral structure, a third-party candidate is not likely to win a general election. Nevertheless, Americans’ willingness—if not downright eagerness—to support a third-party candidate signals that a non-conventional presidential candidate may be able to win one of the two major parties' presidential nominations. This also might explain how a candidate such as Rep. Ron Paul (R-Texas), once considered a very remote longshot, is now third in the GOP race for president according to the latest Gallup poll results.
Preferences for the 2012 Republican Presidential Nomination as
of August 2011
Based on Republicans and Republican-leaning Independents

Note: Ballot support for both announced and potential GOP
presidential candidates.
Source: Gallup and Gallup
If the Tea Party ran its own candidate against President Obama and the Republican nominee in the 2012 presidential election, would you consider voting for him or her?

Would you consider voting for an independent or third-party candidate for president in 2012?

Generally speaking, would you support or oppose an independent or third-party candidate who described him or herself as “conservative on economic issues” and “liberal on social issues”?

Please find full results here.
A new Public Policy Polling (PPP) poll shows that Republicans are much more likely than Democrats to defect to a third-party presidential candidate. All of the talk recently (here, here, here, and here) of a third-party candidate entering the race should be welcome news to President Obama's campaign staff.
Independents will play an important role if a third-party candidate decides to enter the race. Among Independent voters, Ron Paul stands out at 38 percent, the highest favorability rating among potential third-party candidates. Moreover, in a three-way match-up with President Obama and Republican Mitt Romney, Ron Paul garners 20 percent of Independent votes, the most of any potential third-party candidate.


With growing concern about a double-dip recession and a lot discussion about how to stimulate the struggling economy, over 57 percent of Americans say reducing government spending will “mostly help” the economy, according to a new national Reason-Rupe Public Opinion Survey of 1,200 adults. Just 21 percent believe cutting spending will “mostly harm” the economy.
When analyzing the reasons that consumers aren’t spending money, economists should note that the public is bracing for tax increases. Nearly 69 percent of voters expect their taxes to go up in the next five years and only 6 percent expect their taxes to go down. Over 32 percent say they expect their taxes to increase “a lot” in the next five years and more than 36 percent anticipate their taxes will increase “a little.”
If taxes do go up, Americans don’t trust that the new revenue will be used to reduce the national debt. When asked what they expect Congress would do with money generated by tax increases, 62 percent of Americans say Congress would spend that money on new programs. Only 27 percent of taxpayers believe Congress would actually use the money to pay down the national debt.
Taxpayers are also worried about Congress’ inability to balance the federal budget. Over 77 percent of Americans say the federal government needs a spending cap that prevents it from spending more than it takes in during a fiscal year. Ninety-one percent of Republicans, 75 percent of independents and 66 percent of Democrats favor a federal spending cap. Support for a constitutional amendment requiring a balanced federal budget is somewhat lower, but still strong, at 69 percent.
When asked about the best way to reduce the national debt, 37 percent of voters believe reducing federal spending without increasing taxes is the best policy. Another 20 percent say they favor mainly decreasing spending along with some tax increases. Over 24 percent say an equal emphasis on spending cuts and tax increases is the right approach. Just 7 percent favor relying exclusively on tax increases to reduce the national debt, and 8 percent say they favor mostly tax increases combined with some spending reductions.
The Reason-Rupe poll sheds light on how difficult fixing the federal budget’s structural problems will be and shows that choice is going to be the key to any future entitlement reforms. Over 54 percent of Americans favor allowing workers to opt-out of Social Security if they choose to rely on their own retirement savings. And 56 percent support allowing workers to opt-out of Medicare if they choose to pay for their own health care in retirement.
Adding choices will be vital to any reform efforts because there are strong sentiments against other reforms. Sixty-seven percent oppose raising Social Security’s retirement age above the current age of 65; 57 percent of taxpayers are against cutting their current or future Social Security benefits to help balance the federal budget; and 51 percent are against cutting their current or future Medicare benefits to help balance the budget.
However, this picture changes sharply if the people who oppose Social Security or Medicare cuts are assured of receiving benefits that are at least equal to the amount they pay into the entitlement programs. In that scenario, the number of people willing to accept Social Security benefit reductions grows to 61 percent, and 59 percent would accept cuts in Medicare.
Full Poll Online
The complete Reason-Rupe survey is online here (pdf).
This Reason-Rupe poll, conducted August 9-18, 2011, surveyed a random, national sample of 1,200 adults by telephone (790 on landlines, 410 on cell phones). The results have a margin of error of plus or minus 3 percentage points. The poll was conducted for Reason Foundation by NSON Opinion Strategy.
This is part of a series of Reason-Rupe public opinion surveys dedicated to exploring what Americans really think about government and major issues. This Reason Foundation project is made possible thanks to the generous support of the Arthur N. Rupe Foundation.
ABC News Analyst Matthew Dowd recently highlighted a puzzling fact about the American electorate: nearly 51 percent are neither conventional conservatives nor are they conventional liberals. He concludes that the 51 percent must be a “mishmash of independents, and not ideological members of either political party.” The latest Reason-Rupe poll results help identify those Americans who do not fit the conventional liberal-conservative mold.
The Reason-Rupe poll finds that about 24 percent of the electorate consists of small government types: They want government to be less involved in both economic and social issues. Roughly, they could be labeled the “libertarian group." About 20 percent of the electorate, labeled “communitarian,” prefer government to be involved in both economic and social issues. Conventional American liberals, who are economically and socially liberal, make up 28 percent, and American conservatives, who are economically and socially conservative, make up another 28 percent.

Gallup also used a similar grouping method, finding nearly identical results: It found a libertarian group that wants to “keep it small” at 22 percent of the electorate; liberals, or “Obama liberals,” at 24 percent; conservatives, dubbed “Morality first,” at 17 percent; and communitarians, labeled “the bigger the better,” at 20 percent. Gallup also included a fifth group, the “mushy middle” at 17 percent.

Source: Gallup Poll
Methodology:
These four political groups were determined using standard “role of government” questions to understand respondents’ preference for government action in both social and economic issues, as well as their preference for a more activist or limited government overall. The questions are below:
Q51 “The less government the better”; OR, “there are more things that government should be doing.”
Q52 “The government should be doing more to regulate businesses”; OR, “Too often, government regulation of businesses does more harm than good.”
Q53 “We need a strong government to handle today’s complex economic problems”; OR, “People would be better able to handle today’s problems within a free market with less government involvement.”
Q54 Some people think the government should promote traditional values in our society. Others think the government should not favor any particular set of values. Which comes closer to your own view?

Different Ways To Cut It: Similar Results
There are several ways to use standard role of government questions to determine the percentages of the four groups. Using different combinations produces nearly the same results. You can see the results of using different combinations below:

In conclusion, ABC News’ Matthew Dowd, Gallup, and the Reason-Rupe Poll findings together demonstrate a substantially more nuanced view of the American electorate. Americans cannot easily be bundled into either the “liberal” or “conservative” groups, and to do so would be to underestimate the potential for a majority of Americans to provide substantial support for non-conventional candidates.
For more discussion of ideological groups in American politics, please click here.
[Click above to watch Reason Foundation's polling director Emily Ekins discussing the findings of the latest Reason-Rupe Public Opinion Survey]
Former Massachusetts Gov. Mitt Romney holds a 20 percent to 18 percent edge over Texas Gov. Rick Perry among Republicans and Republican-leaning voters in the latest Reason-Rupe Public Opinion Survey.
Two potential candidates not currently in the race, former Alaska Gov. Sarah Palin (12%) and former New York City Mayor Rudy Giuliani (8%), placed third and fourth among Republicans asked to name whom they would favor if the GOP primary were held today. They were followed by Rep. Michele Bachmann (8%), Rep. Ron Paul (7%), Herman Cain (4%), Newt Gingrich (3%), former Minnesota Gov. Tim Pawlenty (2%, but no longer in the race), former Utah Gov. Jon Huntsman (1%), former Pennsylvania Senator Rick Santorum (<1%), and former New Mexico Gov. Gary Johnson (<1%). Approximately 16% of Republican voters are undecided.
This Reason-Rupe poll surveyed a random, national sample of 1,200 adults by telephone (790 on landlines, 410 on cell phones) over August 9-18, 2011. The overall results have a margin of error of plus or minus 3 percentage points. The GOP presidential primary poll question surveyed 419 adults who self-identified as Republican and "lean-Republican"; that specific question has a margin of error of plus or minus 5 percentage points.
Reason-Rupe Republican Primary Presidential Poll
Responses to "If you were voting today in the 2012 Republican presidential primary, which one of the following candidates would you favor?"
Below is a chart of recent national polls listing various GOP hopefuls, updated to reflect the new Reason-Rupe findings:

The above chart shows that Perry’s numbers soar when Palin and Giuliani are not included in the list of candidates (they were not listed in either the Rasmussen or Gallup polls). This suggests Perry may regain a lead over Romney if it becomes clear that Palin and Giuliani will not join the race.
Tea Party favorites Michele Bachmann and Ron Paul came next with 8 percent and 7 percent of respondents respectively. This is especially interesting since Paul and Bachmann came within 152 votes of each other at the Ames Iowa Straw Poll, with Bachmann winning. Paul consistently does well in straw polls, leading many pundits to contend this simply is a result of his being better able to mobilize supporters to come out to events. However, these new Reason-Rupe poll findings suggest that Paul’s competitive standing with Michelle Bachmann extends well beyond his strong showing in Iowa.
Approval Ratings for Congress, President Obama; Support for Third-Party Presidential Candidates
The Reason-Rupe poll of 1,200 adults also finds an overwhelming 81 percent of Americans disapprove of the job Congress is doing while just 14 percent approve. Forty-seven percent of Americans approve of the way President Obama is handling his job, with 48 percent disapproving. The president’s bigger problem may be that 42 percent of Americans say they “definitely will not” vote for him in 2012, while 25 percent say they “will definitely” vote for him, and another 29 percent will consider voting for him.
But voters may not want to limit their 2012 presidential options to just President Obama and the eventual Republican nominee. Nearly 73 percent of Americans say they “will” or “may” consider voting for an independent or third-party candidate in 2012. And in a three-way race like the 1992 presidential election, in which Ross Perot got 19 percent of the vote and Bill Clinton won with 43 percent of the vote, the Reason-Rupe poll finds there would be significant support for a candidate who is “conservative on economic issues and liberal on social issues.” Forty-eight percent of voters say they’d support such a candidate while 37 percent would not. The Tea Party could also make things very interesting if it were to run its own presidential candidate instead of supporting the GOP nominee. Nearly 37 percent of voters say they’d consider voting for a Tea Party candidate for president, 15 percent are undecided, and 49 percent say they wouldn’t support him or her.
Full Poll Online
The Reason-Rupe survey is online here and here (pdf). The poll was conducted for Reason Foundation by NSON Opinion Strategy.
This is part of a series of Reason-Rupe public opinion surveys dedicated to exploring what Americans really think about government and major issues. This Reason Foundation project is made possible thanks to the generous support of the Arthur N. Rupe Foundation.
About Reason Foundation
Reason Foundation is a nonprofit think tank dedicated to advancing free minds and free markets and publisher of the critically-acclaimed Reason magazine and its website www.reason.com. For more information, please visit www.reason.org.
Video interview conducted by Michelle Fields and edited by Josh Swain. Go to Reason.tv for downloadable versions of our videos and subscribe to our YouTube channel to get automatic notification when new material goes lives.
Several recent polls have shown Americans are becoming increasingly skeptical of of Washington’s economic planning capabilities. According to a recent Washington Post poll, 73% of Americans doubt Washington’s ability to solve economic problems. In fact, these numbers have leapt from 52% last year and from 41% in 2002. It appears that the more the government has tried to fix the US economy the less confident Americans are that the government is capable of doing such things.
In general, when the government in Washington decides to solve economic problems, how much confidence do you have that the problem actually will be solved: A lot, some, just a little, or none at all?

Source: Washington Post Poll
Another example of this skepticism toward government economic planning comes from a recent Rasmussen poll finding that 71% of Americans believe the private sector is better than the government at determining technological potential.
Who is better at determining the long-term benefits and potential of new technologies, private sector companies and investors or government officials?
71% Private sector companies and investors
11% Government officials
17% Not sure
This suggests the public is not convinced that President Obama’s “investment” spending will necessarily be properly directed to its most useful ends. For example, in the president’s 2011 State of the Union address, he marshals the word “invest” or “investment” 13 times, with 8 specifically referencing government investment. It is important to remember that when government “invests” in the economy, it requires officials to make decisions about who gets funding. This presupposes that the government has the knowledge to know which technologies have the greatest potential and thus are worthy of investment. Instead of letting billions of individuals work through a marketplace to best allocate resources to the technologies with the greatest potential, this would instead rely on a small, centralized group of intellectuals deciding who gets what.
Also according to this Rasmussen poll the public is not convinced that when the government does “pick winners” to receive government funding, that the money will not be wasted. 64% believe it is likely that if a private company, which cannot find investors, gets funding from the government that the money will be wasted.
Sometimes a company cannot find investors for a new technology and they seek research funding from government. Suppose a private company cannot find investors but gets funding from the government. How likely is it that government funding will be wasted?
30% Very likely
34% Somewhat likely
21% Not very likely
4% Not at all likely
11% Not sure
It might be time to rethink the alluring sound of government “investment” and reevaluate the merits that government has the knowledge necessary to make these sorts of economic decisions.
Asked three different ways, the CNN/ORC poll still finds that a majority of Americans support a balanced budget amendment to the US Constitution; although, one has to read to paragraph thirteen of CNN’s poll analysis to learn of this finding.
According to the analysis, the balanced budget amendment is one of few proposals favored by a majority of Democrats, Independents, and Republicans (see table below). As explained here, only the “cut, cap, and balance” approach, balanced budget amendment, and particular combinations of spending cuts and tax increases earns majority support. Of course, one could argue that the public may not understand the consequences of a balanced budget amendment, but the same could be said for many of these proposals, as unintended consequences may not yet be fully realized. (For example, see effects of luxury tax on yachts)
CNN Poll Results July 18-20 2011
In another proposal, Congress would raise the debt ceiling only if a balanced budget amendment were passed by both houses of Congress and substantial spending cuts and caps on future spending were approved. Would you favor or oppose this proposal?
Favor 66%
Oppose 33%
No Opinion 1%
Would you favor or oppose a constitutional amendment to require a balanced federal budget?
Favor 74%
Oppose 24%
No Opinion 1%
In order to get the federal budget deficit under control, do you think it is necessary or not necessary to pass a Constitutional amendment requiring a balanced federal budget?
Necessary 60%
Not Necessary 38%
No Opinion 1%
In another proposal, Congress would raise the debt ceiling only if a balanced budget amendment were passed by both houses of Congress and substantial spending cuts and caps on future spending were approved. Would you favor or oppose this proposal? (FAVOR)
Democrats 63%
Independents 65%
Republicans 73%
Would you favor or oppose a constitutional amendment to require a balanced federal budget? (FAVOR)
Democrats 66%
Independents 76%
Republicans 84%
In order to get the federal budget deficit under control, do you think it necessary or not necessary to pass a Constitutional amendment requiring a balanced federal budget? (NECESSARY)
Democrats 52
Independents 63
Republicans 68
The support for a balanced budget amendment is not new. Since the early 1990s, CNN has asked questions regarding this proposal and has found little movement in favorability.
Would you favor or oppose a constitutional amendment to require a balanced federal budget?

In order to get the federal budget deficit under control, do you think it is necessary or not necessary to pass a Constitutional amendment requiring a balanced federal budget?

For more details and methodology, see full CNN Poll Results.
This also appeared at Cato@Liberty here.
Overall, more Americans disapprove of the debt ceiling agreement than approve, with 46% disapprove and 39% approve, according to the latest USA Today/Gallup poll.
For weeks Congress and the White House have tensely negotiated raising the national borrowing limit before the Treasury’s August 2nd deadline. Many opined about the lack of compromise during the debate. Interestingly a Washington Post/ABC News poll conducted July 14-17th found that Americans believed Republicans were less willing to compromise than Obama on the budget deficit. In fact 77% of Americans believed that the Republican Party was not willing enough to compromise whereas only 58% of Americans believed that President Obama was not wiling enough to compromise.
However, now that a compromise has been reached, the latest USA Today/Gallup poll finds that majorities of Democrats and liberals support the recent debt ceiling agreement; whereas, majorities of Republicans, Independents, and conservatives oppose it. 58% of Democrats and 51% of liberals said they approved of the agreement reached by the president and Congress to raise the federal debt ceiling, as did 48% of moderates. However 33% of Independents, 26% of Republicans, and 25% of conservatives agreed.
This could mean several things; one, the debt ceiling agreement tilted in favor of the Democrats. It could also mean that Democrats are more likely to be appeased by a compromise in general. However, the majority of Independents who also disapprove of the debt ceiling agreement casts doubt on the later explanation.
Most Americans agree, however, that the debt ceiling agreement is neither a step forward or backward in terms of addressing the federal debt situation. Meaning, they think it probably does nothing to substantively deal with the national debt. Only 17% believe that the compromise will improve the economy compared to the plurality (41%) who believe it will make the economy worse.
Next, I’d like to ask you about the agreement reached by the president and Congress to raise the federal debt ceiling. Based on what you know or have rad about this agreement, do you approve or disapprove of it?

Nearing the one-year anniversary that President Obama signed the Dodd-Frank Act into law on July 21, 2010, debate over the debut of the controversial Consumer Financial Protection Bureau (CFPB) heats up. Moreover, polling data reveals that the public is not entirely convinced that more regulations will best solve problems in financial markets.
The Dodd-Frank’s CFPB will add additional regulations on the lending practices of banks, mortgage lenders, and credit card companies. As the Wall Street Journal reports, critics argue “that it is a flawed agency that has too much authority over financial firms without enough congressional oversight”. Last fall, President Obama bypassed the Senate confirmation process and appointed Harvard law professor, and long time critic of the financial industry, Elizabeth Warren to help set up the new regulatory bureau. Ms. Warren is convinced of and has argued for years for the need for more regulations to protect consumers from the financial industry. However, her advocacy for more regulations could be problematic if additional regulations also reduce competition in the marketplace, as is often inadvertently the case.
Interestingly, a Rasmussen national telephone survey conducted last fall found that a majority of Americans believe that more competition rather than more regulation is the best way to protect borrowers from unfair lending practices.
What will do more to protect borrowers from unfair lending practices: more competition or more government regulation?
More competition 51%
More government regulation 29%
Not Sure 20%
Moreover, another recent survey conducted this month by Rasmussen found that a majority of all voters believe that increased competition rather than increased government regulation is the best way to hold big businesses accountable. Only 34% believe increased regulation provides a better solution.
What is the best way to hold big businesses accountable—increased competition or increased regulation?
More competition 56%
More government regulation 34%
Not Sure 10%
A new Rasmussen national telephone survey found that 72% of likely voters believe a free market economy performs better than an economy managed by the government. Only 14% favor the government management approach, and 14% are not sure.
A survey finding that most Americans favor free markets may not come as a surprise to many; however, the survey also revealed a startling difference for public sector workers among which nearly half favor government management of the economy. In other words only 14% of likely voters favor government management of the economy compared to 53% of public sector employees. Among private sector employees 75% favor free markets over government management of the economy.
The survey of 1,000 Likely Voters was conducted on July 6-7, 2011 by Rasmussen Reports. The margin of sampling error is +/- 3 percentage points with a 95% level of confidence. Field work for all Rasmussen Reports surveys is conducted by Pulse Opinion Research, LLC. See methodology.
The new Dodd-Frank financial regulation law mandates the Federal Reserve cap fees business charge retailers when customers use a credit or debit card. These fees are called ‘swiping fees’.
According to a recent IBOPE Zogby poll, when respondents were asked whether or not they support “caps on the ‘swiping fees’”, overwhelmingly 66% of respondents supported this cap. Moreover, when asked if respondents supported increased regulations on bank-fees, 60% also agreed. However, these questions did not take into account the unforeseen consequences of such regulations. Laws such as these do not operate in a vacuum and thus influence other actions taken by banks, retailers, and customers. The subsequent Zogby questions reveal our preferences change when costs are considered.
When respondents were then asked if they would support capping ‘swiping fees “even if, as a consequence, banks limit the amount per transaction (For example, banks could limit each transaction to $50)” then support for these caps plummeted to 34%. Moreover, when prompted what would be the likely consequences of capping banking fees, the majority 56% of respondents answered an “increase in bank-imposed restrictions on the services” compared to only 22% who thought it would lead to “more affordable banking services with no significant changes”.
This survey reveals how consumer preference for regulation changes when the costs of such regulations are considered. In the case of bank swiping fees, it is not clear whether or not Americans believe the benefits outweigh the costs.
A 'swiping fee' is a fee that a business pays to a bank whenever a customer uses a credit or a debit card. Regulators are currently considering capping the 'swiping fees'. Would you support or oppose caps on the 'swiping fees'?
| Response | % |
| Strongly + somewhat support | 66% |
| Strongly + somewhat oppose | 23% |
| Not sure/refuse | 11% |
Do you support or oppose increased regulations on bank-fees?
| Response | % |
| Strongly + somewhat support | 60% |
| Strongly + somewhat oppose | 31% |
| Not sure/refuse | 10% |
Would you support or oppose caps on the 'swiping fees' even if, as a consequence, banks limit amount per transaction? (For example, banks could limit each transaction to $50).
| Response | % |
| Strongly + somewhat support | 34% |
| Strongly + somewhat oppose | 48% |
| Not sure/refuse | 18% |
What do you think the most likely consequences would be of capping the fees of banking services?
| Response | % |
| Increase in bank-imposed restrictions on the services | 56% |
| More affordable banking services with no significant changes | 22% |
| Not sure/refused | 19% |
| Other | 2% |
Totals may not add up to 100% due to rounding.
Read the full results from the IBOPE Zogby Poll here.
From the latest New York Times/CBS Poll asking respondents about their perception of the housing market:
In general, do you think the government should be doing more to help the housing market improve, should it be doing less, or is the government doing the right amount?
More 45%
Less 16%
About Right 30%
Laden in this question is the assumption that the government is capable of making a meaningful and positive improvement to the housing market. It also suggests that the quantity of involvement is somehow correlated with the quality of results. Congress could do little and simply write one really poor piece of legislation. It is not obvious that the amount of government involvement causes an improved outcome.
It also suggests, if only the politicians in Washington could get their act together, they could write up a new piece of legislation and solve the nation’s housing market problems.
Perhaps a better question might be “how capable to you believe the government is at helping the housing market improve?”
If GOP presidential hopeful Mitt Romney could be used as a political barometer to gauge where mainstream Republicans are going, he hits the mark according to the Pew Research Center’s political typology survey.
In the second GOP presidential debate on June 13 in New Hampshire, Mitt Romney declared, “It’s time for us to bring our troops home as soon as we possibly can…Only the Afghanis can win Afghanistan’s independence from the Taliban”.
Pew Research Center data released on May 4 shows a dramatic shift in the public’s desire to be active in world affairs and deal with problems overseas, even among conservative Republicans.
In 2004, 58% of conservative Republicans believed it was best to be active in world affairs, compared to only 39% in 2011. In 2004, 49% of conservative Republicans wanted to pay less attention to problems overseas compared to 58% in 2011.
Among all political groups a majority agree America should pay less attention to problems overseas, with 55% conservative Republicans, 54% liberal/moderate Republicans, 59% Independents, 63% conservative/moderate Democrats, 57% liberal Democrats.
Click here to read more.

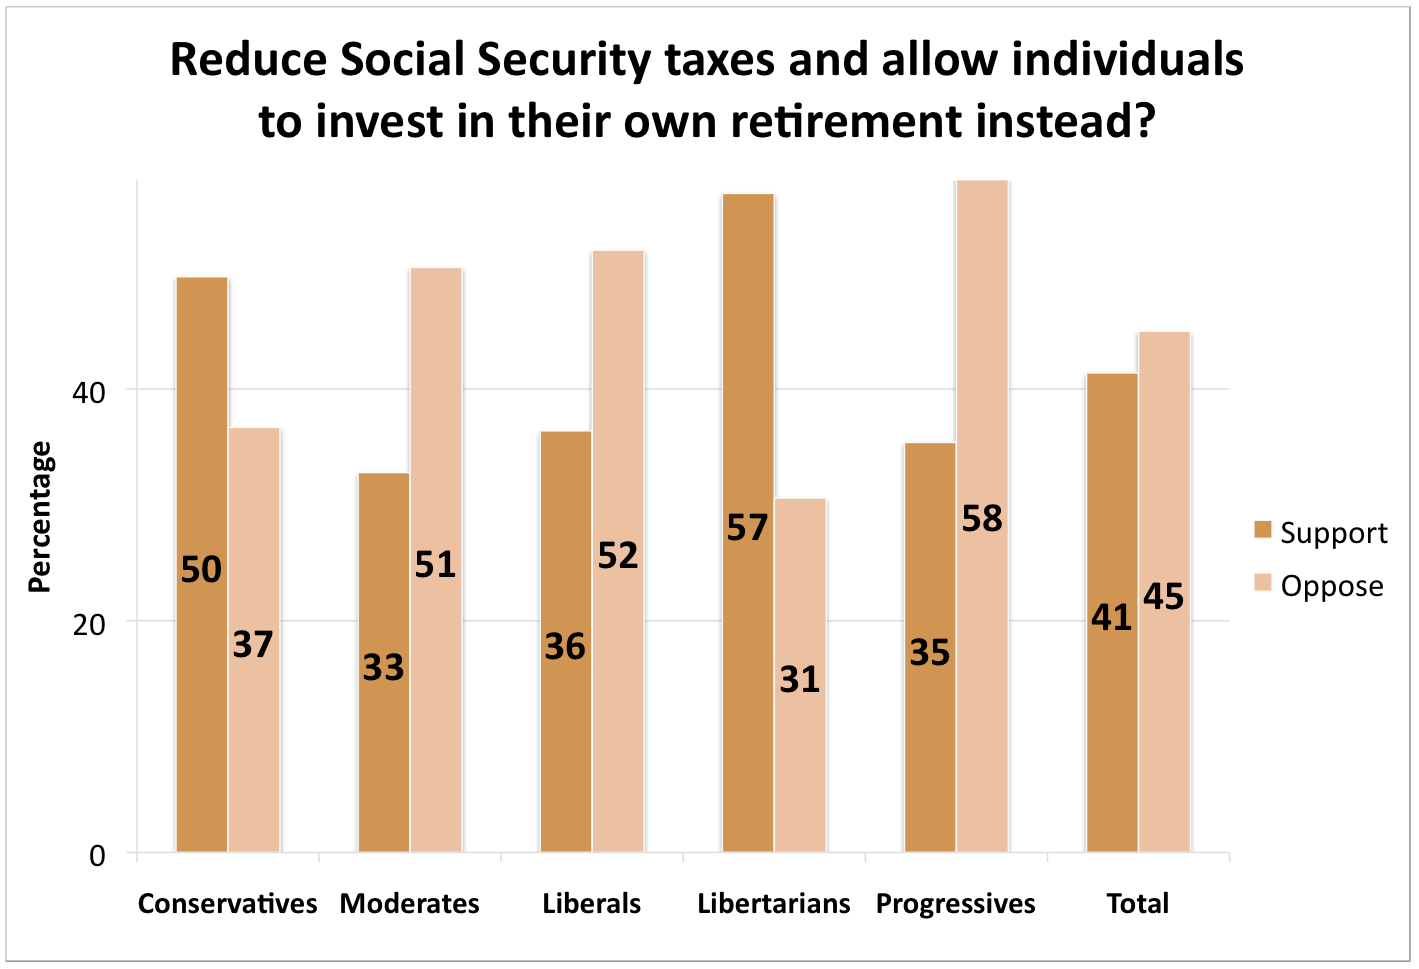
The recent Reason-Rupe poll asked respondents if they would support or oppose reducing Social Security taxes and allow individuals to invest in their own retirement instead.
For the following proposal, please tell me whether you would strongly support, somewhat support, neither support nor oppose, somewhat oppose, or strongly oppose this proposal: “Reducing Social Security taxes and allowing individuals to invest in their own retirement instead?”
Strongly Support 25 Somewhat Support 16 Neither 10 Somewhat Oppose 13 Strongly Oppose 32 Don't Know 4 Total 100
Support significantly varies across demographic and household characteristics. As detailed in an earlier blog post, more Americans aged 54 and younger favor reducing Social Security taxes and allowing individuals to invest in their own retirement instead. In stark contrast, Americans 55 years and older oppose such measures roughly 60% to 30%.

Support for this reform divides college graduates, those with some college education, and high school graduates. However, a majority of those without high school diplomas (52%) and those with post-graduate degrees (53%) oppose this reform. Little difference exists across income groups, except among those making less than $25,000 a year with 52% opposed and 35% in favor.


Significant differences emerge across racial/ethnic groups on reducing Social Security taxes. A plurality of Caucasians (44%) and Asians (44%) favor this measure. However, a majority of African-Americans (59%) and Latinos (52%) oppose this reform.

Women are also less likely to support this proposal, whereas men are evenly divided with slightly more in favor.

Significant differences emerge across the political landscape, with 57% of self-identified libertarians in support of this reform, and 58% of progressives opposed to it. 50% of conservatives support the reform in contrast to the 51% of moderates and 52% of liberals who oppose it. Partisanship reveals that 64% of Tea Party supporters favor this proposal, as does 50% of non-Tea Party Republicans. In contrast, a majority (58%) of Democrats, and a plurality (46%) of pure Independents oppose this proposal. This is especially interesting because although the Tea Party tends to be older, they are the most likely group to favor this proposal—even more than regular Republicans.
Note: Ideological groups self-identified.

Note: Tea Party supporters reported they were “very favorable” to the Tea Party movement. Non-TP Republicans self-identified as Republican and were not Tea Party supporters. Independents only included Independents who did not lean Republican or Democratic. Democrats self-identified as such.
A majority of union households oppose this proposal (53%), whereas non-union households slightly favor reform. Further blogs will explore the differences between union and non-union households.

Note: “Neither”, “Don’t Know”, and “Other” responses were omitted for this blog post. “Total” refers to the topline results from the 1200 respondents.
The recent Reason-Rupe poll asked 1200 adults nationwide whether they would favor or oppose reducing social security taxes and allowing individuals to invest in their own retirement instead. The topline results revealed an America evenly divided on this issue with 45% opposed and 41% in favor. However, when examining the results by age, a different story emerges.

All age groups up to age 54 favor reducing social security taxes and allowing individuals to invest in their own retirement instead. For young Americans age 18-29, a majority (52%) support compared to 31% who oppose. In contrast, Americans 55 and older clearly oppose such measures with 58% opposed and about 30% in favor.

A previous post detailed differences of opinion between private sector and public sector workers on public sector compensation and collective bargaining. Further analysis reveals an interesting difference and a point of agreement between the two groups.
The Reason-Rupe poll found private sector workers are more likely to support reducing Social Security taxes and allowing individuals to invest in their own retirements instead. Nearly half, 49 percent, of private sector workers support reducing Social Security taxes and allowing them to invest in their own retirement accounts. The numbers are flipped for government workers, with half of them, 50 percent, opposed and just 37 percent in favor of reducing Social Security taxes and allowing individuals to invest in their own retirements.

Interestingly public and private sector workers agree on federal income tax rates. Both groups favor replacing the federal income tax with a flat tax. Sixty percent of private sector workers and 55 percent of government employees support eliminating the current complicated federal income tax system and replacing it with a flat tax.

The flat tax findings for the two groups are right in line with the overall poll results for that question, where 56 percent of Americans said they favor a flat tax.
Q: For the following proposals, please tell me whether you would strongly support, somewhat support, neither support nor oppose, somewhat oppose, or strongly oppose each one.
-Changing the federal tax system to a flat tax, where everyone pays the same percentage of their income.
Answers:
Strongly Support 35.2
Somewhat Support 21.0
Neither Support nor Oppose 7.9
Somewhat Oppose 9.6
Strongly Oppose 22.0
Don't Know/ No Response 4.3
As I noted earlier, 50 percent of Americans believe that public sector employees receive better benefits than those with similar jobs in the private sector. Just 14 percent believe government employees receive benefits that are worse than the private sector's.

The Reason-Rupe telephone poll of 1,200 Americans also asked respondents who stated they were working full-time if they worked in the public or private sector, providing unique insight into the two groups.
Of people working full-time in the private sector, 60 percent believe government employees have better benefits than those working in similar jobs in the private sector.In contrast, just 44 percent of public sector employees say that they receive better benefits than workers in similar jobs in the private sector.

The Reason-Rupe poll followed up by asking if respondents would support or oppose cutting public employee benefit plans to help balance state budgets. Only 37 percent of Americans favored cutting government worker benefits, with over 44 percent opposed.

The answers to this question are somewhat different when looking at where people work, however. It's clear-cut that 61 percent of government workers oppose cutting their own benefits. Full-time private sector workers, however, are in favor of cutting government worker benefits to help balance state budgets - 45 percent support, 37 percent oppose.


The opinion split was nearly identical when the two groups were asked if they would favor taking away some of the collective bargaining rights of most public sector unions. A clear majority of public sector workers opposed curtailing collective bargaining rights while a plurality of private sector employees supported such measures. When all respondents were included, 43 percent of the public opposed reducing collective bargaining rights and 36 percent supported doing so.

Note about the charts: "Total" includes all survey respondents, "Public Sector" includes respondents working full time in the public sector, "Private Sector" includes respondents working full time in the private sector or self-employed.
The full Reason-Rupe poll (pdf) and the crosstabs (pdf).
Earlier this year as the debate over public sector pay and benefits raged in Wisconsin and elsewhere, USA Today reported: "Wisconsin is one of 41 states where public employees earn higher average pay and benefits than private workers in the same state." The Reason-Rupe poll:
Question: "On average, do you think public sector employees have better benefits, the same benefits, or poorer benefits than those with similar jobs in the private sector?"
Answers:
Better Benefits 50.2%
Same Benefits 17.0%
Poorer Benefits 14.2%
Don't Know/ No Response 18.7%
So just over half of Americans think government workers get better benefits than people working similar jobs in the private sector. Sixty-six percent of Republicans say public sector employees receive better benefits than those in the private sector, while just 44 percent of independents and 40 percent believe that to be true.

There is also a large difference among a few demographic groups: barely a third of African-Americans and Latinos think public sector employees receive better benifets but well over half of all Asian and whites say public workers benefits are better.

Young Americans are the least likely to say government worker benefits top the private sector's. A majority of voters over the age of 45 say the public sector receives better benefits.

And the more money someone makes the more likely they are to believe public sector workers enjoy better pay and benefits. Just 37 percent of those making less than $25,000 a year say government workers receive better benefits but that number steadily rises to 68 percent among those making over $200,000 a year.

The full Reason-Rupe poll (pdf) and the crosstabs (pdf).

Site comments/questions:
Media Inquiries and Reprint Permissions:
(310) 367-6109
Editorial & Production Offices:
3415 S. Sepulveda Blvd.
Suite 400
Los Angeles, CA 90034
(310) 391-2245