

Politics
11 Cognitive Biases That Influence Political Outcomes


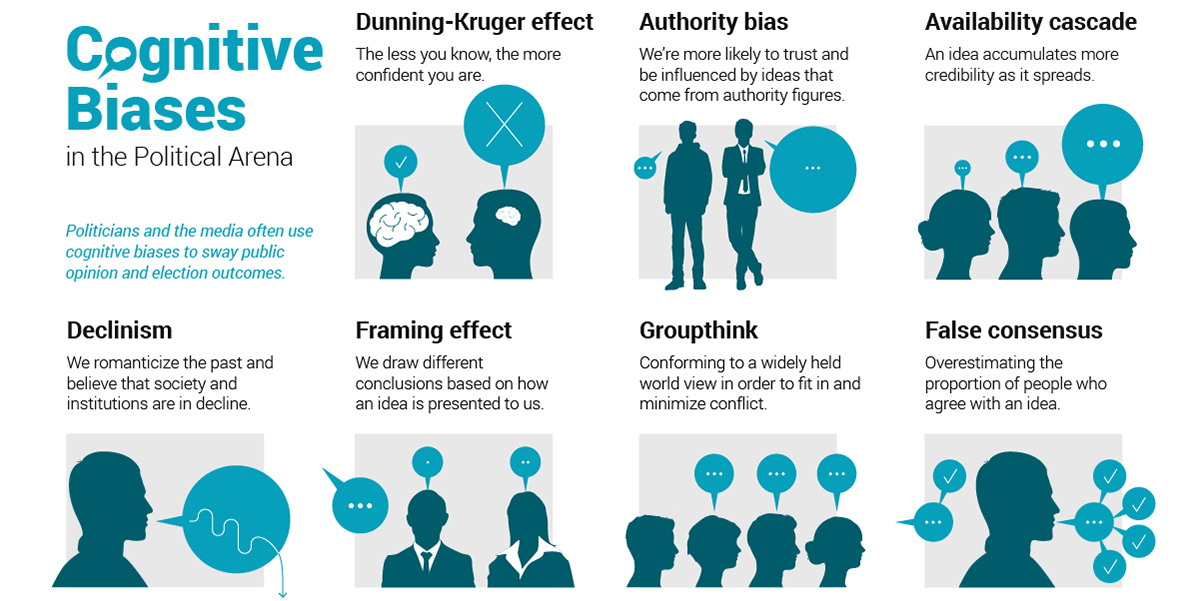
Cognitive Biases in the Political Arena
With the 2020 U.S. presidential election fast approaching, many people will be glued to the 24-hour news cycle to stay up to date on political developments. Yet, when searching for facts, our own cognitive biases often get in the way.
If this isn’t problematic enough, third parties can also take advantage of these biases to influence our thinking. The media, for example, can exploit our tendency to assign stereotypes to others by only providing catchy, surface-level information. Once established in our minds, these generalizations can be tough to shake off.
Such tactics can have a powerful influence on public opinion if applied consistently to a broad audience. To help us avoid these mental pitfalls, today’s infographic from PredictIt lists common cognitive biases that influence the realm of politics, beginning with the “Big Cs”.
The First C: Confirmation Bias
People exhibit confirmation bias when they seek information that only affirms their pre-existing beliefs. This can cause them to become overly rigid in their political opinions, even when presented with conflicting ideas or evidence.
When too many people fall victim to this bias, progress towards solving complex sociopolitical issues is thwarted. That’s because solving these issues in a bipartisan system requires cooperation from both sides of the spectrum.
A reluctance towards establishing a common ground is already widespread in America. According to a 2019 survey, 70% of Democrats believed their party’s leaders should “stand up” to President Trump, even if less gets done in Washington. Conversely, 51% of Republicans believed that Trump should “stand up” to Democrats.
In light of these developments, researchers have conducted studies to determine if the issue of confirmation bias is as prevalent as it seems. In one experiment, participants chose to either support or oppose a given sociopolitical issue. They were then presented with evidence that was conflicting, affirming, or a combination of both.
In all scenarios, participants were most likely to stick with their initial decisions. Of those presented with conflicting evidence, just one in five changed their stance. Furthermore, participants who maintained their initial positions became even more confident in the superiority of their decision—a testament to how influential confirmation bias can be.
The Second C: Coverage Bias
Coverage bias, in the context of politics, is a form of media bias where certain politicians or topics are disproportionately covered. In some cases, media outlets can even twist stories to fit a certain narrative.
For example, research from the University of South Florida analyzed media coverage on President Trump’s 2017 travel ban. It was discovered that primetime media hosts covered the ban through completely different perspectives.
Each host varied drastically in tone, phrasing, and facts of emphasis, […] presenting each issue in a manner that aligns with a specific partisan agenda.
—Josepher, Bryce (2017)
Charting the ideological placement of each source’s audience can help us gain a better understanding of the coverage bias at work. In other words, where do people on the left, middle, and right get their news?
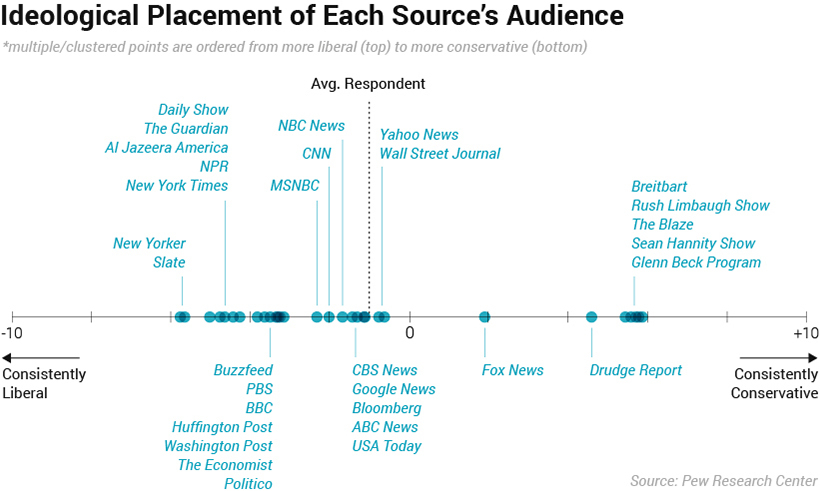
The horizontal axis in this graphic corresponds to the Ideological Consistency Scale, which is composed of 10 questions. For each question, respondents are assigned a “-1” for a liberal response, “+1” for a conservative response, or a “0” for other responses. A summation of these scores places a respondent into one of five categories:
| Ideological Category | Ranking |
|---|---|
| Consistently conservative | +7 to +10 |
| Mostly conservative | +3 to +6 |
| Mixed | -2 to +2 |
| Mostly liberal | -6 to -3 |
| Consistently liberal | -10 to -7 |
Overcoming coverage bias—which dovetails into other biases like confirmation bias—may require us to follow a wider variety of sources, even those we may not initially agree with.
The Third C: Concision Bias
Concision bias is a type of bias where politicians or the media selectively focus on aspects of information that are easy to get across. In the process, more nuanced and delicate views get omitted from popular discourse.
A common application of concision bias is the use of sound bites, which are short clips that can be taken out of a politician’s speech. When played in isolation, these clips may leave out important context for the audience.
Without the proper context, multi-faceted issues can become extremely polarizing, and may be a reason for the growing partisan divide in America. In fact, there is less overlap in the political values of Republicans and Democrats than ever previously measured.
In 1994, just 64% of Republicans were more conservative than the median Democrat. By 2017, that margin had grown considerably, to 95% of Republicans. The same trend can be found on the other end of the spectrum. Whereas 70% of Democrats were more liberal than the median Republican in 1994, this proportion increased to 97% by 2017.
Overcoming Our Biases
Achieving full self-awareness can be difficult, especially when new biases emerge in our constantly evolving world. So where do we begin?
Simply remembering these mental pitfalls exist can be a great start—after all, we can’t fix what we don’t know. Individuals concerned about the upcoming presidential election may find it useful to focus their attention on the Big Cs, as these biases can play a significant role in shaping political beliefs. Maintaining an open mindset and diversifying the media sources we follow are two tactics that may act as a hedge.


Oil and Gas
Ranked: The Largest Oil Supply Disruptions in History
See how large oil supply losses were during historic events, and how much greater the supply loss from the closure of the Strait of Hormuz is than those from all other events.


Ranked: The Largest Oil Supply Disruptions in History
Key Takeaways
- The closure of the Strait of Hormuz caused a supply loss of 10.1 million barrels per day in March 2026, the largest oil supply shock on record.
- The Strait of Hormuz closure caused an oil supply loss nearly twice the 5.6 million barrels per day lost during the Iranian Revolution, the next-largest disruption.
- Four of the seven major supply disruptions shown occurred between 1973 and 1991, including the Arab oil embargo, Iran-Iraq War, and invasion of Kuwait.
Wars, revolutions, embargoes, and chokepoint disruptions have repeatedly removed millions of barrels of oil per day from global markets, putting pressure on prices and energy security.
This visualization compares seven major oil supply disruptions, measured in millions of barrels per day. The data comes from the IEA via the World Bank Commodity Markets Outlook, with the figure for the Strait of Hormuz closure referring specifically to March 2026, the latest available as of April 2026.
Strait of Hormuz Closure Is Largest Oil Supply Disruption in History
The scale of the disruption reflects the Strait of Hormuz’s importance to global energy markets. Located in the Persian Gulf, the world’s leading oil trading region, the strait is a critical maritime chokepoint that typically handles about 20% of global petroleum trade.
Iran has largely blocked shipping traffic through the Strait of Hormuz since February 28, 2026, when the United States and Israel launched an air war against Iran.
The near halt in tanker movements through the strait has caused Gulf countries to cut oil production, with supply losses likely to increase as long as shipping flows remain affected.
| Event | Timeframe | Oil supply loss in million barrels per day |
|---|---|---|
| Strait of Hormuz closure | March 2026 | -10.1 |
| Iranian Revolution | November 1978–April 1979 | -5.6 |
| Arab oil embargo | October 1973–March 1974 | -4.3 |
| Invasion of Kuwait | August 1990–January 1991 | -4.3 |
| Iran-Iraq War | October 1980–January 1981 | -4.1 |
| Iraq War | March–December 2003 | -2.3 |
| Civil war in Libya | February–October 2011 | -1.5 |
Before the Strait of Hormuz closure, the Iranian Revolution represented the largest oil supply disruption among the events shown. From November 1978 to April 1979, falling oil production resulted in a supply loss of 5.6 million barrels per day.
The March 2026 Hormuz disruption exceeded that by 4.5 million barrels per day, or about 80%.
Revolutions, Embargoes, and Wars Causing Disruptions
Two other major disruptions each caused losses of 4.3 million barrels per day: the Arab oil embargo and the invasion of Kuwait.
The Arab oil embargo, which lasted from October 1973 to March 1974, caused an almost fourfold increase in oil prices and forced some countries to ration fuel due to shortages. It is considered the first major global oil crisis and led to the creation of the International Energy Agency (IEA).
The invasion of Kuwait disrupted supply from August 1990 to January 1991 and caused global oil prices to double in a matter of days.
Close behind, the Iran-Iraq War caused a supply loss of 4.1 million barrels per day between October 1980 and January 1981.
Smaller, Yet Significant Supply Losses in the 2000s
The early period of the Iraq War (March–December 2003) and the civil war in Libya (February–October 2011) caused smaller losses than the major shocks of the 1970s, 1980s, and early 1990s.
Still, their impacts were significant in absolute terms: the Iraq War caused a supply loss of 2.3 million barrels per day, while Libya’s civil war led to a loss of 1.5 million barrels per day.
Five of the seven disruptions shown are tied to the Middle East, highlighting the region’s outsized importance to global oil supply. The 2026 Strait of Hormuz closure stands apart as the first event in the dataset to surpass a supply loss of 10 million barrels per day.
Learn More on the Voronoi App
If you enjoyed today’s post, check out Mapping: Oil Flows Through the Strait of Hormuz on the Voronoi app, where you can discover thousands of data-driven visualizations from trusted sources around the world.
War
America’s Missile Interceptor Stockpiles Have Plunged
U.S. Patriot interceptor inventories have fallen by roughly two-thirds since the Iran war began, with CSIS estimating a three-year rebuild for both Patriot and THAAD stockpiles.


America’s Missile Interceptor Stockpiles Have Plunged
Key Takeaways
- U.S. Patriot interceptor inventories have fallen from an estimated 2,330 before the Iran war to 759–827 as of July 27, 2026, a decline of roughly two-thirds.
- THAAD interceptor stocks are down by nearly half over the same period, from 452 to an estimated 239–257.
- CSIS estimates both systems will take at least three years to return to pre-war inventory levels, with new FY 2027 orders not arriving until 2029.
Months of intercepting Iranian missile barrages have drawn down America’s stockpiles of its two most important air-defense interceptors far faster than they can currently be replaced.
Since the start of the Iran war in late February, combined Patriot and THAAD interceptor inventories have fallen by roughly 1,700 missiles.
This graphic visualizes estimated U.S. Patriot and THAAD interceptor inventories, based on public-source estimates from the Center for Strategic and International Studies (CSIS), with per-interceptor values from U.S. Army and Missile Defense Agency FY 2027 procurement references.
How Much of America’s Missile Inventory Is Left?
Patriot accounts for the vast majority of the absolute decline in U.S. interceptor stocks, reflecting its much larger pre-war inventory and heavy use during the conflict.
THAAD stocks have also fallen substantially. While fewer THAAD interceptors have been expended, each costs more than twice as much as a Patriot interceptor.
The table below compares estimated U.S. inventories of both interceptor types before the war and as of July 27, 2026:
| Missile System | Estimated U.S. Interceptor Inventory | Estimated Decline (%) | |
|---|---|---|---|
| Pre-war (Feb. 27, 2026) | July 27, 2026 | ||
| Patriot | 2,330 | 759–827 | 64.5–67.4% |
| THAAD | 452 | 239–257 | 43.1–47.1% |
A PAC-3 MSE interceptor used by Patriot systems costs roughly $5 million in the FY 2027 budget request. A THAAD interceptor, designed to destroy ballistic missiles at longer ranges and higher altitudes than Patriot, costs nearly $12 million.
Both systems are being used primarily against Iranian ballistic missiles. Using FY 2027 unit costs as a rough benchmark, replacing the estimated drawdown would cost about $10 billion.
A Three-Year Road Back to Pre-War Levels
According to CSIS analysis of Pentagon delivery projections, Patriot and THAAD stockpiles will each take at least three years to return to pre-war levels. THAAD’s FY 2027 order of 857 interceptors is projected to complete the replacement of Iran-war usage by the end of 2029.
Washington is spending heavily to close the gap as global military spending climbs. The FY 2027 defense budget includes a $95 billion munitions request, with another $21 billion in a war supplemental. Lockheed Martin also plans to more than triple PAC-3 MSE production capacity and expand THAAD output from 96 to 400 interceptors per year.
Until those deliveries arrive, CSIS warns that depleted stockpiles create a window of vulnerability. With no good alternatives to Patriot and THAAD for ballistic missile defense, every interceptor fired over the Middle East will take at least one to two years to replace.
Learn More on the Voronoi App
If you enjoyed today’s post, check out The Global Defense Industry in One Chart on Voronoi.
-
 Personal Finance6 days ago
Mapped: The Cost to Retire Comfortably Around the World
-
population3 weeks ago
Mapped: Which Countries Are Best for Women?
-
Green2 weeks ago
Ranked: The Countries With the Most Freshwater
-
Technology3 weeks ago
Ranked: Where the iPhone Costs the Most in 2026
-
Misc3 days ago
Mapped: Paid Vacation Days Around the World
-
Immigration3 weeks ago
The World’s Most Powerful Passports (2016 vs. 2026)
-
Countries1 week ago
Ranked: Where Child Poverty Is Highest in the OECD
-
Countries2 weeks ago
Ranked: Countries by Share of People Who Have Traveled Abroad


