


A public opinion research project exploring attitudes about government.


A public opinion research project exploring attitudes about government.
Overall, more Americans disapprove of the debt ceiling agreement than approve, with 46% disapprove and 39% approve, according to the latest USA Today/Gallup poll.
For weeks Congress and the White House have tensely negotiated raising the national borrowing limit before the Treasury’s August 2nd deadline. Many opined about the lack of compromise during the debate. Interestingly a Washington Post/ABC News poll conducted July 14-17th found that Americans believed Republicans were less willing to compromise than Obama on the budget deficit. In fact 77% of Americans believed that the Republican Party was not willing enough to compromise whereas only 58% of Americans believed that President Obama was not wiling enough to compromise.
However, now that a compromise has been reached, the latest USA Today/Gallup poll finds that majorities of Democrats and liberals support the recent debt ceiling agreement; whereas, majorities of Republicans, Independents, and conservatives oppose it. 58% of Democrats and 51% of liberals said they approved of the agreement reached by the president and Congress to raise the federal debt ceiling, as did 48% of moderates. However 33% of Independents, 26% of Republicans, and 25% of conservatives agreed.
This could mean several things; one, the debt ceiling agreement tilted in favor of the Democrats. It could also mean that Democrats are more likely to be appeased by a compromise in general. However, the majority of Independents who also disapprove of the debt ceiling agreement casts doubt on the later explanation.
Most Americans agree, however, that the debt ceiling agreement is neither a step forward or backward in terms of addressing the federal debt situation. Meaning, they think it probably does nothing to substantively deal with the national debt. Only 17% believe that the compromise will improve the economy compared to the plurality (41%) who believe it will make the economy worse.
Next, I’d like to ask you about the agreement reached by the president and Congress to raise the federal debt ceiling. Based on what you know or have rad about this agreement, do you approve or disapprove of it?

Nearing the one-year anniversary that President Obama signed the Dodd-Frank Act into law on July 21, 2010, debate over the debut of the controversial Consumer Financial Protection Bureau (CFPB) heats up. Moreover, polling data reveals that the public is not entirely convinced that more regulations will best solve problems in financial markets.
The Dodd-Frank’s CFPB will add additional regulations on the lending practices of banks, mortgage lenders, and credit card companies. As the Wall Street Journal reports, critics argue “that it is a flawed agency that has too much authority over financial firms without enough congressional oversight”. Last fall, President Obama bypassed the Senate confirmation process and appointed Harvard law professor, and long time critic of the financial industry, Elizabeth Warren to help set up the new regulatory bureau. Ms. Warren is convinced of and has argued for years for the need for more regulations to protect consumers from the financial industry. However, her advocacy for more regulations could be problematic if additional regulations also reduce competition in the marketplace, as is often inadvertently the case.
Interestingly, a Rasmussen national telephone survey conducted last fall found that a majority of Americans believe that more competition rather than more regulation is the best way to protect borrowers from unfair lending practices.
What will do more to protect borrowers from unfair lending practices: more competition or more government regulation?
More competition 51%
More government regulation 29%
Not Sure 20%
Moreover, another recent survey conducted this month by Rasmussen found that a majority of all voters believe that increased competition rather than increased government regulation is the best way to hold big businesses accountable. Only 34% believe increased regulation provides a better solution.
What is the best way to hold big businesses accountable—increased competition or increased regulation?
More competition 56%
More government regulation 34%
Not Sure 10%
A new Rasmussen national telephone survey found that 72% of likely voters believe a free market economy performs better than an economy managed by the government. Only 14% favor the government management approach, and 14% are not sure.
A survey finding that most Americans favor free markets may not come as a surprise to many; however, the survey also revealed a startling difference for public sector workers among which nearly half favor government management of the economy. In other words only 14% of likely voters favor government management of the economy compared to 53% of public sector employees. Among private sector employees 75% favor free markets over government management of the economy.
The survey of 1,000 Likely Voters was conducted on July 6-7, 2011 by Rasmussen Reports. The margin of sampling error is +/- 3 percentage points with a 95% level of confidence. Field work for all Rasmussen Reports surveys is conducted by Pulse Opinion Research, LLC. See methodology.
The new Dodd-Frank financial regulation law mandates the Federal Reserve cap fees business charge retailers when customers use a credit or debit card. These fees are called ‘swiping fees’.
According to a recent IBOPE Zogby poll, when respondents were asked whether or not they support “caps on the ‘swiping fees’”, overwhelmingly 66% of respondents supported this cap. Moreover, when asked if respondents supported increased regulations on bank-fees, 60% also agreed. However, these questions did not take into account the unforeseen consequences of such regulations. Laws such as these do not operate in a vacuum and thus influence other actions taken by banks, retailers, and customers. The subsequent Zogby questions reveal our preferences change when costs are considered.
When respondents were then asked if they would support capping ‘swiping fees “even if, as a consequence, banks limit the amount per transaction (For example, banks could limit each transaction to $50)” then support for these caps plummeted to 34%. Moreover, when prompted what would be the likely consequences of capping banking fees, the majority 56% of respondents answered an “increase in bank-imposed restrictions on the services” compared to only 22% who thought it would lead to “more affordable banking services with no significant changes”.
This survey reveals how consumer preference for regulation changes when the costs of such regulations are considered. In the case of bank swiping fees, it is not clear whether or not Americans believe the benefits outweigh the costs.
A 'swiping fee' is a fee that a business pays to a bank whenever a customer uses a credit or a debit card. Regulators are currently considering capping the 'swiping fees'. Would you support or oppose caps on the 'swiping fees'?
| Response | % |
| Strongly + somewhat support | 66% |
| Strongly + somewhat oppose | 23% |
| Not sure/refuse | 11% |
Do you support or oppose increased regulations on bank-fees?
| Response | % |
| Strongly + somewhat support | 60% |
| Strongly + somewhat oppose | 31% |
| Not sure/refuse | 10% |
Would you support or oppose caps on the 'swiping fees' even if, as a consequence, banks limit amount per transaction? (For example, banks could limit each transaction to $50).
| Response | % |
| Strongly + somewhat support | 34% |
| Strongly + somewhat oppose | 48% |
| Not sure/refuse | 18% |
What do you think the most likely consequences would be of capping the fees of banking services?
| Response | % |
| Increase in bank-imposed restrictions on the services | 56% |
| More affordable banking services with no significant changes | 22% |
| Not sure/refused | 19% |
| Other | 2% |
Totals may not add up to 100% due to rounding.
Read the full results from the IBOPE Zogby Poll here.
From the latest New York Times/CBS Poll asking respondents about their perception of the housing market:
In general, do you think the government should be doing more to help the housing market improve, should it be doing less, or is the government doing the right amount?
More 45%
Less 16%
About Right 30%
Laden in this question is the assumption that the government is capable of making a meaningful and positive improvement to the housing market. It also suggests that the quantity of involvement is somehow correlated with the quality of results. Congress could do little and simply write one really poor piece of legislation. It is not obvious that the amount of government involvement causes an improved outcome.
It also suggests, if only the politicians in Washington could get their act together, they could write up a new piece of legislation and solve the nation’s housing market problems.
Perhaps a better question might be “how capable to you believe the government is at helping the housing market improve?”
If GOP presidential hopeful Mitt Romney could be used as a political barometer to gauge where mainstream Republicans are going, he hits the mark according to the Pew Research Center’s political typology survey.
In the second GOP presidential debate on June 13 in New Hampshire, Mitt Romney declared, “It’s time for us to bring our troops home as soon as we possibly can…Only the Afghanis can win Afghanistan’s independence from the Taliban”.
Pew Research Center data released on May 4 shows a dramatic shift in the public’s desire to be active in world affairs and deal with problems overseas, even among conservative Republicans.
In 2004, 58% of conservative Republicans believed it was best to be active in world affairs, compared to only 39% in 2011. In 2004, 49% of conservative Republicans wanted to pay less attention to problems overseas compared to 58% in 2011.
Among all political groups a majority agree America should pay less attention to problems overseas, with 55% conservative Republicans, 54% liberal/moderate Republicans, 59% Independents, 63% conservative/moderate Democrats, 57% liberal Democrats.
Click here to read more.

The recent Reason-Rupe poll asked respondents if they would support or oppose reducing Social Security taxes and allow individuals to invest in their own retirement instead.
For the following proposal, please tell me whether you would strongly support, somewhat support, neither support nor oppose, somewhat oppose, or strongly oppose this proposal: “Reducing Social Security taxes and allowing individuals to invest in their own retirement instead?”
Strongly Support 25 Somewhat Support 16 Neither 10 Somewhat Oppose 13 Strongly Oppose 32 Don't Know 4 Total 100
Support significantly varies across demographic and household characteristics. As detailed in an earlier blog post, more Americans aged 54 and younger favor reducing Social Security taxes and allowing individuals to invest in their own retirement instead. In stark contrast, Americans 55 years and older oppose such measures roughly 60% to 30%.

Support for this reform divides college graduates, those with some college education, and high school graduates. However, a majority of those without high school diplomas (52%) and those with post-graduate degrees (53%) oppose this reform. Little difference exists across income groups, except among those making less than $25,000 a year with 52% opposed and 35% in favor.


Significant differences emerge across racial/ethnic groups on reducing Social Security taxes. A plurality of Caucasians (44%) and Asians (44%) favor this measure. However, a majority of African-Americans (59%) and Latinos (52%) oppose this reform.

Women are also less likely to support this proposal, whereas men are evenly divided with slightly more in favor.

Significant differences emerge across the political landscape, with 57% of self-identified libertarians in support of this reform, and 58% of progressives opposed to it. 50% of conservatives support the reform in contrast to the 51% of moderates and 52% of liberals who oppose it. Partisanship reveals that 64% of Tea Party supporters favor this proposal, as does 50% of non-Tea Party Republicans. In contrast, a majority (58%) of Democrats, and a plurality (46%) of pure Independents oppose this proposal. This is especially interesting because although the Tea Party tends to be older, they are the most likely group to favor this proposal—even more than regular Republicans.

Note: Ideological groups self-identified.

Note: Tea Party supporters reported they were “very favorable” to the Tea Party movement. Non-TP Republicans self-identified as Republican and were not Tea Party supporters. Independents only included Independents who did not lean Republican or Democratic. Democrats self-identified as such.
A majority of union households oppose this proposal (53%), whereas non-union households slightly favor reform. Further blogs will explore the differences between union and non-union households.

Note: “Neither”, “Don’t Know”, and “Other” responses were omitted for this blog post. “Total” refers to the topline results from the 1200 respondents.
The recent Reason-Rupe poll asked 1200 adults nationwide whether they would favor or oppose reducing social security taxes and allowing individuals to invest in their own retirement instead. The topline results revealed an America evenly divided on this issue with 45% opposed and 41% in favor. However, when examining the results by age, a different story emerges.

All age groups up to age 54 favor reducing social security taxes and allowing individuals to invest in their own retirement instead. For young Americans age 18-29, a majority (52%) support compared to 31% who oppose. In contrast, Americans 55 and older clearly oppose such measures with 58% opposed and about 30% in favor.

A previous post detailed differences of opinion between private sector and public sector workers on public sector compensation and collective bargaining. Further analysis reveals an interesting difference and a point of agreement between the two groups.
The Reason-Rupe poll found private sector workers are more likely to support reducing Social Security taxes and allowing individuals to invest in their own retirements instead. Nearly half, 49 percent, of private sector workers support reducing Social Security taxes and allowing them to invest in their own retirement accounts. The numbers are flipped for government workers, with half of them, 50 percent, opposed and just 37 percent in favor of reducing Social Security taxes and allowing individuals to invest in their own retirements.

Interestingly public and private sector workers agree on federal income tax rates. Both groups favor replacing the federal income tax with a flat tax. Sixty percent of private sector workers and 55 percent of government employees support eliminating the current complicated federal income tax system and replacing it with a flat tax.

The flat tax findings for the two groups are right in line with the overall poll results for that question, where 56 percent of Americans said they favor a flat tax.
Q: For the following proposals, please tell me whether you would strongly support, somewhat support, neither support nor oppose, somewhat oppose, or strongly oppose each one.
-Changing the federal tax system to a flat tax, where everyone pays the same percentage of their income.
Answers:
Strongly Support 35.2
Somewhat Support 21.0
Neither Support nor Oppose 7.9
Somewhat Oppose 9.6
Strongly Oppose 22.0
Don't Know/ No Response 4.3
As I noted earlier, 50 percent of Americans believe that public sector employees receive better benefits than those with similar jobs in the private sector. Just 14 percent believe government employees receive benefits that are worse than the private sector's.

The Reason-Rupe telephone poll of 1,200 Americans also asked respondents who stated they were working full-time if they worked in the public or private sector, providing unique insight into the two groups.
Of people working full-time in the private sector, 60 percent believe government employees have better benefits than those working in similar jobs in the private sector.In contrast, just 44 percent of public sector employees say that they receive better benefits than workers in similar jobs in the private sector.

The Reason-Rupe poll followed up by asking if respondents would support or oppose cutting public employee benefit plans to help balance state budgets. Only 37 percent of Americans favored cutting government worker benefits, with over 44 percent opposed.

The answers to this question are somewhat different when looking at where people work, however. It's clear-cut that 61 percent of government workers oppose cutting their own benefits. Full-time private sector workers, however, are in favor of cutting government worker benefits to help balance state budgets - 45 percent support, 37 percent oppose.


The opinion split was nearly identical when the two groups were asked if they would favor taking away some of the collective bargaining rights of most public sector unions. A clear majority of public sector workers opposed curtailing collective bargaining rights while a plurality of private sector employees supported such measures. When all respondents were included, 43 percent of the public opposed reducing collective bargaining rights and 36 percent supported doing so.

Note about the charts: "Total" includes all survey respondents, "Public Sector" includes respondents working full time in the public sector, "Private Sector" includes respondents working full time in the private sector or self-employed.
The full Reason-Rupe poll (pdf) and the crosstabs (pdf).
Earlier this year as the debate over public sector pay and benefits raged in Wisconsin and elsewhere, USA Today reported: "Wisconsin is one of 41 states where public employees earn higher average pay and benefits than private workers in the same state." The Reason-Rupe poll:
Question: "On average, do you think public sector employees have better benefits, the same benefits, or poorer benefits than those with similar jobs in the private sector?"
Answers:
Better Benefits 50.2%
Same Benefits 17.0%
Poorer Benefits 14.2%
Don't Know/ No Response 18.7%
So just over half of Americans think government workers get better benefits than people working similar jobs in the private sector. Sixty-six percent of Republicans say public sector employees receive better benefits than those in the private sector, while just 44 percent of independents and 40 percent believe that to be true.

There is also a large difference among a few demographic groups: barely a third of African-Americans and Latinos think public sector employees receive better benifets but well over half of all Asian and whites say public workers benefits are better.

Young Americans are the least likely to say government worker benefits top the private sector's. A majority of voters over the age of 45 say the public sector receives better benefits.

And the more money someone makes the more likely they are to believe public sector workers enjoy better pay and benefits. Just 37 percent of those making less than $25,000 a year say government workers receive better benefits but that number steadily rises to 68 percent among those making over $200,000 a year.

The full Reason-Rupe poll (pdf) and the crosstabs (pdf).
Although President Obama thinks the very idea is hilarious, recent polls pretty consistently find that more than two-fifths of Americans support marijuana legalization. Last month's Reason-Rupe Public Opinion Survey fits that pattern, finding that 41 percent of Americans favor "the legalization of small amounts of marijuana for personal use," compared to 44 percent who oppose that policy. Support was stronger among independents and Democrats (48 percent for both) than it was among Republicans (32 percent) or Tea Party supporters (35 percent). Not surprisingly, self-identified "libertarians" were more than twice as likely to support legalization as self-identified "conservatives," with "moderates," "liberals," and "progressives" falling in between. There was not much variation between income groups or groups with different levels of education (except for those without high school diplomas, only one-third of whom favored legalization). But the gender gap on this question is striking: Forty-nine percent of men supported legalization vs. 34 percent of women. Likewise the generation gap: Only 23 percent of those 65 and older supported legalization; support was twice as high among respondents younger than 55. Religious attendance also was inversely related to support for legalization: Fifty-seven percent of respondents reporting "low" attendance were pot-tolerant, compared to 26 percent of those reporting "high" attendance. I suspect old Republican women who go to church a lot are the group least sympathetic to this cause...Continue reading this post...
Republican lawmakers responded to the government hitting its debt limit with proposals for spending caps. The Treasury Department announced Monday that it was tapping into a pair of government employee pension funds as it reached its borrowing capacity. Sen. Bob Corker (R-Tenn.) and Rep. Jack Kingston (R-Ga.) both responded to the news by touting their spending-cap proposals as the way to rein in the nation's debt.
…Corker's plan would set a cap on discretionary and mandatory spending, which would eventually lower the current spending rate of 24.7 percent of the nation's gross domestic product (GDP) to 20.6 percent. If lawmakers fail to meet that cap, the Office of Management and Budget (OMB) would be required to make cuts throughout the federal budget to meet the prescribed limit.
…Kingston's plan would go even further than Corker's, capping spending at 18 percent of GDP. Like Corker's plan, it would also require OMB to make across-the-board cuts to get spending to meet that cap if lawmakers cannot. Both proposals would require a two-thirds majority in Congress to override the caps.
The recent Reason-Rupe national telephone survey of 1,200 adults found that over 74 percent of Americans say the federal government should have spending cap that prevents it from spending more than it takes in during a fiscal year. Sixty-four percent of Democrats support implementing a spending cap, as do 76 percent of independents and nearly 85 percent of Republicans.

Just 19 percent of Americans say they “strongly disagree” or “disagree” with capping federal spending. Slightly more than a quarter of Democrats, 27.5 percent, are against a federal spending cap. And opposition to a government spending cap drops significantly from there: only 17 percent of independents and 10 percent of Republicans oppose a cap.

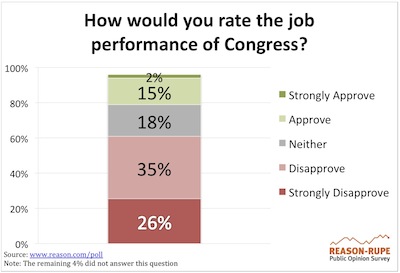
The latest Reason-Rupe poll finds Americans remain unimpressed by Congress and its performance. When asked how respondents would rate Congress’ job performance, approval barely reached 17%. 18% say they neither approve nor disapprove, and a resounding 61% say they disapprove of Congress’ performance.
When asked if respondents believed they would be better off, worse off, or no different if Congress were in session every other year, the most common response at 42% was no different. 36% of Americans thought they would be worse off and 16% said they would be better off. This also indicates that if Congress were to meet every other year, 58% believe there would be no difference or that the country would be better off.

Democrats were most concerned that Congress meeting every two years would make the country worse off, with 42%. In contrast, only 26% of Tea Party supporters agreed and 29% thought the country would be better off compared to 12% of Democrats. Across all political groups except Democrats, the plurality response was that Congress meeting every two years would be no different than it meeting each year.

Note: Tea Party supporters reported they were “very favorable” to the Tea Party movement. Non-TP Republicans self-identified as Republican and were not Tea Party supporters. Independents only included Independents who did not lean Republican or Democratic. Democrats self-identified as such.
Across education groups, besides post-graduates, the most common response to Congress meeting every two years was there would be no difference. Only those with post-graduate degrees were most likely to say the country would be worse off.

You can read the full poll results here.
The recent Reason-Rupe poll finds that 80% of Americans say they would or might consider voting for an Independent or third-party presidential candidate in the 2012 election. Specifically, 60% said they would consider voting for an independent or third-party candidate, 20% said they might consider, 17% said they would not consider, and 3% said they did not know whether they would consider voting for an Independent or third-party presidential candidate.

To be clear, considering and voting are two separate things. Nevertheless, the high percentage tells us something about the current political climate. It means that individuals are willing to at least consider candidates who do not necessarily fit the cookie-cutter molds of Democrats and Republicans and suggests that the electorate is receptive to unconventional candidates.
Across partisan identification, 89% of Independents (including partisan leaners), 86% of Republicans, and 71% of Democrats said they would or might consider candidates outside of the two major political parties.

Note: Partisan identification is based on Q42 in the
questionnaire. Independents include both Democratic and Republican
leaners as well as pure independents.
Beyond receptiveness to unconventional partisan candidates, Americans report having little trust in the two major political parties. When asked which party they trust to govern more responsibly, the leading answer was “neither” at 35%, followed by Democrats at 31%, and Republicans at 23%.

These answers varied by political views. 83% of pure independents (non-leaners), 35% of non-Tea Party Republicans, 30% of Tea Party supporters, and 25% of Democrats answered that “neither” party could be trusted to govern responsibly. Taking into consideration margin of error, Tea Party supporters and non-Tea Party Republicans are statistically the same and Democrats are only somewhat less likely to state “neither”. This reveals that there is considerable discontent toward the major political parties even among members of both parties.

Note: Tea Party supporters reported they were “very favorable”
to the Tea Party movement. Republicans (not Tea Party)
self-identified as Republican and are not Tea Party supporters.
Independents only include Independents who did not lean Republican
or Democratic. Democrats self-identified as such.
Democrats appear to be more favorable toward the Democratic Party than are Republicans toward the Republican Party with 66% of Democrats trusting the Democratic Party to govern most responsibly. In contrast, 46% of Tea Partiers, and 55% of non-Tea Party Republicans trust the Republican Party to govern most responsibly.
Trust in the two primary political parties remained fairly constant across most demographics. However distrust in the parties does change across income and education. The groups least trusting of the two dominant parties include households making $50,000-$99,999 a year (39%/40%) and high school and college graduates (37%/40%).


Those making less than $25,000 a year and those making over $200,000 a year were least likely to choose “neither” and thus more trusting of one of the dominant parties. Those making less than $25,000 a year were most likely to say the Democratic Party (40%) and 17% said the Republican Party. Of those making over $200,000 a year the group was split between trusting Democrats and Republicans, with 33% choosing Republicans and 28% choosing Democrats. Those without a high school degree and those with a post-graduate degree were also more trusting of one of the political parties. Of high school graduates, 49% chose Democrats and 12% chose Republicans. Of those with post-graduate degrees 38% chose Democrats and 22% choose Republicans.
To date, media coverage of the public’s worries over deficit spending has focused on the lack of consensus for how to deal with the nation’s $14 trillion-plus national debt. Analysts and commentators often observe that survey respondents simultaneously call for spending cuts but support maintaining current levels of Medicare, Social Security, and other large-ticket items. Yet, it is not surprising that when survey questions fail to provide realistic immediate trade-offs to survey respondents their answers may lack consistency or feasibility. Typically, pollsters do not follow up with the sorts of inquiries that would clarify the apparent confusion.
The first Reason-Rupe quarterly poll underscores that although the public is divided about how to tackle the national debt, 96% agree that reducing it is important. Moreover, 69% believe reducing the national debt is very important.

This finding is consistent across all demographic groups, party identification, age, income, education, gender, religious activity, and employment status. Significant differences do emerge among political groups answering that reducing the debt is “very important”. With 85% of Tea Party supporters and 80% of non-Tea Party Republicans believing reducing the national debt is very important compared to 59% of Democrats and 60% of Independents. (Non-Tea Party Republicans and nonTP GOP refer to respondents who self-identified as Republicans but were not Tea Party supporters. Tea Party supporters were defined as respondents who said they were very favorable toward the Tea Party.) Despite these differences, solid majorities agree that the debt is a problem.

Note: Tea Party supporters reported they were “very favorable” to the Tea Party movement. nonTP GOP self-identified as Republican who are not Tea Party supporters. Independents only include Independents who did not lean Republican or Democratic. Democrats self-identified as such.
These findings are notable because it reminds policy makers that even though the public may be divided about how to handle the national debt, they emphatically agree that it should be addressed.
In terms of strategy to reduce the debt, the Reason-Rupe poll shows a clear majority (74%) of Americans favor a government-spending cap. This does not directly address reducing the debt, but it does mean slowing its rate of growth. Republicans (84%) and Independents (81%) are significantly more likely to want a spending cap than Democrats (64%), though a strong majority of all favored the limit. (The opposition to a spending cap may be the result of a preference for using increased government spending during a recession in efforts to stimulate the economy. A spending cap would make this difficult.)


When given the trade-off between reducing spending and raising taxes, the largest response (45%) was to reduce spending while maintaining current taxation levels. Another 16% of respondents wanted to primarily reduce spending along with some increase in taxes, bringing the total of those wanting to focus on lowering spending to 61%. Of the remaining respondents, 14% wanted equal emphasis on both increasing taxes and reducing spending, 8% wanted to primarily increase taxes with some reduction in spending, 4% wanted to increase taxes while maintaining current spending, and 11% said they did not have an opinion.
Another way to cut this data is to note that 45% wanted to decrease spending with no increase in taxes and 42% were comfortable with some increase in taxes. It remains unclear to what extent these individuals would tolerate higher taxes, or if they assume that those making over $250,000 a year would be the only group paying higher taxes.

The preference for reducing spending while maintaining existing tax levels varies by political views: 63% of Tea Party supporters, 52% of Republicans, 46% of Independents, and 35% of Democrats want to reduce spending with no increase in taxes. Preferences also substantially vary by age. Fifty-four percent of those between 45-54 years of age wanted to reduce spending and oppose tax increases; for people between 18-29, the figure is 35% Most income groups hovered around 45% but nearly 60% of those making over $200,000 a year wanted spending cuts with no tax increases. This is understandable given President Obama’s calls for tax increases on only those making over $250,000 a year.


In an effort to learn what government programs respondents want to cut the Reason-Rupe poll used an open-ended question asking survey respondents to state in a few words what if any programs the government should spend less on. Results were inconclusive, though the plurality response (22%) called for less spending on the military. Entitlements were mentioned by 5% of respondents and “everything” by another 5%.

These findings present a quandary to the plethora of other polls showing opposition to cutting Medicare, Social Security, and Medicaid (More polls found here). In particular, a recent Washington Post/ABC poll found that 78% opposed cutting Medicare spending, 69% opposed cutting Medicaid spending, and 56% opposed cutting military spending (these three items comprise the largest portions of the federal budget). While Americans seem reluctant to want to cut spending for programs they like, when asked about the trade-off between raising taxes and reducing spending, 45% would rather reduce spending than raise taxes to pay for these programs. Of the 42% who would support some tax increases, it is unclear to what extent they would tolerate higher taxes themselves or if they assume these taxes would be paid by Americans making over $250,000 a year. The Washington Post/ABC poll found taxing households making over $250,000 a popular remedy with 72% supporting. Then again, it is not entirely surprising that individuals who want lower spending, lower taxes, and more services would prefer others to pay. However, given that raising taxes on the upper income deciles is not enough to solve budget deficits and the national debt, it remains unclear what the public believes should be done. Ultimately, the answer relies on how individuals make trade-offs when confronted with the costs, and whether they opt for paying higher taxes themselves, having other people pay higher taxes, reducing spending on programs they like, or some combination of all three. We intend to explore these questions in future polls.
Los Angeles (May 3, 2011) — As the federal government rapidly approaches the $14.3 trillion debt ceiling, 96 percent of Americans say it is important to reduce the national debt, according to a new Reason Foundation-Rupe poll. Of those surveyed, 69 percent believe reducing the national debt is “very important.”
With the debt piling up, it is also clear that taxpayers do not trust the federal government to live within its means. In fact, the Reason-Rupe survey finds 74 percent of Americans support implementing a spending cap that would prohibit the government from spending more money than it takes in during a fiscal year. Only 19 percent oppose a government spending cap.
The most popular policy prescription for reducing the national debt is spending cuts: 45 percent of people say Congress should bring down the debt by reducing spending without raising taxes. Another 16 percent favor reducing the debt primarily through spending cuts, but are open to some tax increases; 14 percent prefer an equal emphasis on spending cuts and tax increases; 8 percent want to reduce the debt primarily through higher taxes with some spending cuts; 4 percent say current spending levels should be maintained and taxes should be raised as needed; and 1 percent of Americans say we shouldn’t do anything about the debt.
Open-Ended Questions on the Economy and Spending
The Reason-Rupe poll included several open-ended questions that allowed respondents to voice concerns and share their own ideas. When asked to name the biggest problem facing America today, 30 percent say the economy, 23 percent emphasize jobs and unemployment, and 10 percent cite government spending, debts and deficits.
When given the opportunity to name any government program they’d like to spend less money on 22 percent of Americans suggest cutting military and defense spending. Welfare (10 percent) and foreign aid (10 percent) were the other most-named cuts. When asked, open-ended, what the government should spend more money on, 39 percent say education, 16 percent focus on helping the poor and needy, and 13 percent single out health care.
2012 Presidential Election
With the 2012 election season ramping up, frustrated voters appear ready to look beyond Democratic and Republican candidates. Eighty percent say they will or may consider voting for a third-party or independent presidential candidate in 2012. And an even higher number of independents (89 percent) and GOP voters (86 percent) say they will or may consider candidates outside of the two major political parties.
The willingness to look beyond Democrats and Republicans stems, in part, from voters’ lack of trust in them. When asked which political party they trust to govern responsibly, the leading answer was “neither,” at 35 percent, followed by Democrats at 31 percent and Republicans at 23 percent. The survey also found 58 percent of voters believe they’d either see “no difference” or be “better off” if Congress were only in session every other year.
Taxes
Having recently filed their federal income taxes, 56 percent of Americans support replacing the current complicated tax system with a flat tax. Forty-four percent also favor, and 36 percent oppose, giving up the mortgage interest deduction and other tax breaks if it results in a simpler system with lower overall tax rates. One tax change that respondents are against is a national sales tax. Just 33 percent of Americans support replacing federal income taxes with a national sales tax.
When asked about the amount of federal, state, local and property taxes they pay, 51 percent of Americans say they pay too much in taxes, 41 percent believe they pay about the right amount and 4 percent think they pay too little.
Public Sector Benefits and Pensions
Half of all respondents say that public sector workers receive better benefits that those with similar jobs in the private sector, but only 37 percent support cutting those public employee benefits to help balance state budgets.
Drug Legalization and Medical Marijuana
Forty-one percent of the country supports legalizing small quantities of marijuana for personal use, while 44 percent opposes legalization. And in the wake of federal raids on medical cannabis dispensaries in states where medical marijuana has already been legalized, 69 percent of Americans say each state should be allowed to regulate medical marijuana use within its borders.
Full Poll Online
The full Reason-Rupe survey is available here. This Reason-Rupe poll surveyed a random, national sample of 1,200 adults by telephone (859 on landlines, 341 on cell phones) from March 24 to April 9, 2011. The results have a margin of error of plus or minus 3 percentage points. The poll was conducted for Reason Foundation by NSON Opinion Strategy.
This is the first in a series of Reason-Rupe public opinion surveys dedicated to exploring what Americans really think about government and major issues. This Reason Foundation project is made possible thanks to the generous support of the Arthur N. Rupe Foundation.
We will be publishing further in-depth analysis of the results in the coming weeks, as well as additional underlying data. We invite your feedback and discussion of the survey and its results.
See Reason.tv's video on the poll:

Site comments/questions:
Media Inquiries and Reprint Permissions:
(310) 367-6109
Editorial & Production Offices:
3415 S. Sepulveda Blvd.
Suite 400
Los Angeles, CA 90034
(310) 391-2245